Reading Evolutionary Trees — Print · Grade 10 Science
Chapter: Evolution, Ancestry & BiodiversityReading Evolutionary Trees
Learning goals
- I can identify common ancestry from branching relationships.
- I can evaluate molecular and anatomical evidence without treating a tree as a ladder.
Readings for this unit
Before this unit
Identify a node and trace shared branches.
Use three flexible study sessions: core explanation and Parts 1–2; Parts 3–4 with their reasoning checks and models; then the whole-unit application, worked examples, independent practice, and exit check. Allow about 50–60 minutes per session, including diagrams, data work, and notebook explanations. Attempt each check before opening its guidance. Schedule chapter investigations, review, and exams separately; add time where prerequisites are uncertain. Trace the explained visual parts and write a first model, then attempt the illustrated and changed independent cases. In the third session explain a correction and revise the opening account using evidence.
Start with something to explain
Why can two differently arranged tree drawings show the same ancestry?
Illustrative evidence case. A/B branches rotate around their common node while the rooted relationships remain.
Notice and wonder
Record two observations using the stated quantities or relationships. Keep observations separate from possible causes. Write one question that a new measurement could help answer.
Why can two differently arranged tree drawings show the same ancestry?
Your first model
Mark common ancestors and distinguish topology from tip placement and branch length.
Build the language from the idea
- node
- A branching point representing a common ancestor in a tree model.
- sister lineages
- Two lineages joined at their most recent shared node.
- derived feature
- A feature changed from the ancestral state used for comparison.
A phylogenetic tree represents a hypothesis about branching ancestry. A node joins lineages at a common ancestor; taxa sharing a more recent node are more closely related on that tree. Tips are sampled lineages, not stages along a ladder from simple to superior. Living species are not automatically ancestors of other living tips.
Rotating branches around a node does not change relationships. Left-to-right placement and visual closeness can mislead. Branch length represents time or change only when the diagram explicitly defines a scale. An unresolved branching pattern indicates that the evidence or presentation does not distinguish a particular order.
Scientists compare shared derived features and molecular sequences to test trees. Similarity can also arise independently, and one short sequence can be misleading. Compare multiple independent features, appropriate models, and uncertainty. New evidence can refine a tree without erasing all earlier evidence for common ancestry.
A branch point represents a common ancestor in a tree model. Relatedness depends on the most recent shared ancestor, not the left-to-right spacing of tips. Rotating branches around a node leaves the represented relationships unchanged.
A living species at a tip is not automatically the ancestor of another living tip. Branch lengths may represent time or change only if the diagram's key says so. Without that scale, they are graphical arrangement rather than a numerical measure.
Trees are hypotheses inferred from characters or sequences and can change with evidence. Compare whether different datasets support the same grouping. Explain the evidence and uncertainties instead of treating every drawn tree as equally well established.
Build your understanding
Use three flexible study sessions: core explanation and Parts 1–2; Parts 3–4 with their reasoning checks and models; then the whole-unit application, worked examples, independent practice, and exit check. Allow about 50–60 minutes per session, including diagrams, data work, and notebook explanations. Attempt each check before opening its guidance. Schedule chapter investigations, review, and exams separately; add time where prerequisites are uncertain.
Part 1 · What the lines and nodes mean
A phylogeny is a relationship model. A node represents a common ancestor or lineage divergence under the model; a tip represents a sampled lineage. Sister groups share the most recent common ancestor relative to other included groups. The root specifies orientation in ancestry. Living tips are not automatically ancestors of other living tips, and “later on the page” does not mean more evolved. Identify nodes and ancestry relationships rather than rank organisms by visual height or complexity.
Read the visual model
Identify the labeled structures and units, then trace the arrows or compare values under the caption’s stated conditions. Separate the displayed evidence from a further inference. Write your reasoning before opening the guidance.
Which pair is closest under this supplied rooted topology?
Visual reasoning — after your attempt
A and B share the most recent common ancestor with each other; C joins at an earlier node.
A cladogram represents inferred relationships. The tips are the species or groups being compared, the lines are lineages through time, and each node is a most recent common ancestor of everything above it. Reading a tree means reading nodes: two groups are more closely related than a third if they share a node that the third does not.
Time runs from the root toward the tips. A node closer to the tips represents a more recent common ancestor, so the question "which is more closely related" is always answered by finding the most recent shared node, never by measuring the distance between tips across the page.
Pause and explain
Two tips are drawn far apart on the page but share a node near the tips. Are they closely related?
Check your reasoning after answering
Yes. Relatedness depends on how recently lineages share a common ancestor, which the node position shows. Horizontal distance across the page carries no meaning.
Part 2 · Shared derived characters build the tree
Topology is the branching relationship independent of how a tree is laid out. Rotating branches around a node changes displayed tip order while preserving shared ancestry. A shared derived character is a feature interpreted as arising on a particular lineage relative to the comparison; it can help constrain a group. Missing data, reversals and convergence can complicate character interpretation. Test character histories on the topology rather than treating adjacent printed labels as automatically sister groups.
Read the visual model
Identify the labeled structures and units, then trace the arrows or compare values under the caption’s stated conditions. Separate the displayed evidence from a further inference. Write your reasoning before opening the guidance.
Does exchanging the displayed A/B tip order make A closer to C?
Visual reasoning — after your attempt
No. The same node still links A and B; their displayed order has changed, not the topology.
Trees are inferred from characters shared by some groups and not others. A character present in an ancestor and retained widely says little about relationships within the group, because everything has it. What is informative is a derived character — one that arose in a particular lineage — because the groups sharing it are likely to have inherited it from the ancestor in which it arose.
Molecular data work the same way and supply far more characters, which is why sequence comparison has reshaped many trees. The reasoning is identical: shared derived features indicate shared ancestry, while features shared by everything, or shared because of independent origin, do not.
Pause and explain
Why is a character present in every species being compared useless for resolving relationships among them?
Check your reasoning after answering
Because all of them have it, it cannot separate any subset from the rest. It was present in their common ancestor and tells you only that they share that ancestor, which was already assumed.
Part 3 · What a tree does not claim
A branch metric may represent elapsed time, genetic change or another quantity when explicitly defined. Many classroom cladograms show topology only, so drawn horizontal distance cannot establish divergence dates or which lineage changed fastest. Missing lineages and unresolved nodes also limit interpretation. A long branch on an unscaled diagram is not evidence of greater complexity, age or survival value. Read the legend, rooting and sampling before attempting any quantitative relationship comparison.
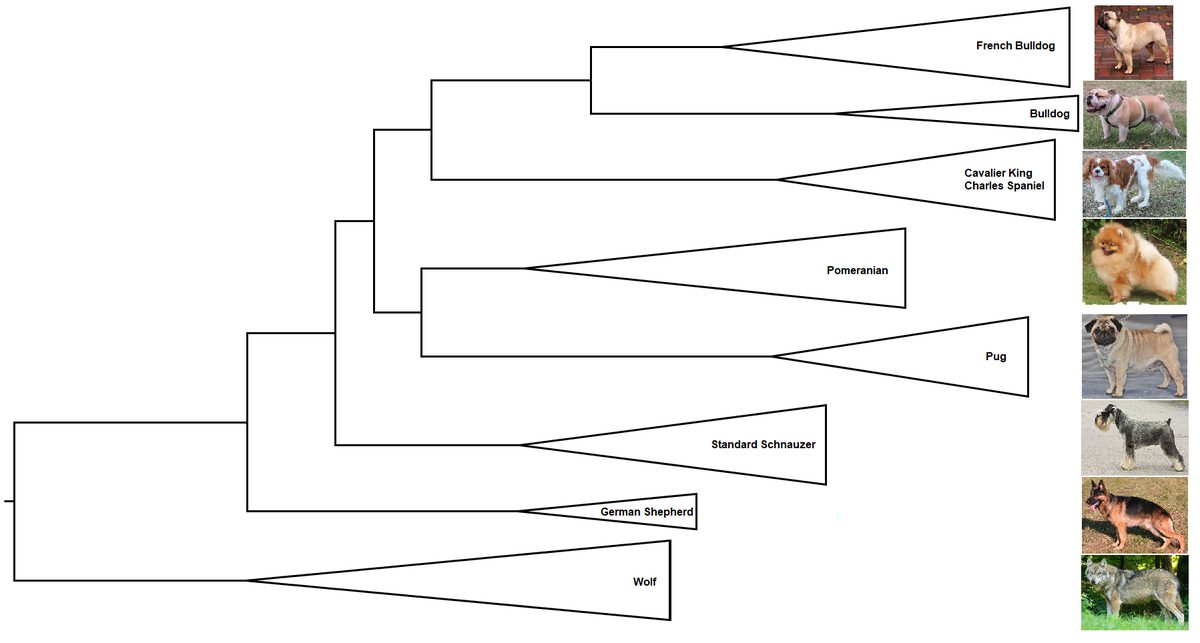
Read the visual model
Identify the labeled structures and units, then trace the arrows or compare values under the caption’s stated conditions. Separate the displayed evidence from a further inference. Write your reasoning before opening the guidance.
Can this arbitrary-length tree tell when A and B diverged?
Visual reasoning — after your attempt
No. A dated or otherwise calibrated model and uncertainty are needed; topology alone supplies relative relationships.
Several readings of a tree are not supported by it. A tip positioned to one side is not more advanced; all tips of a tree of living groups exist now and have had the same elapsed time since any common ancestor. A tip near the root's branch is not an ancestor of the others, only a lineage that separated earlier. And the tree does not claim that one living group descended from another living group.
Branch rotation makes the point concrete. Swapping the two branches at any node produces a drawing that looks different and asserts exactly the same relationships, so any conclusion that changes when branches are rotated was never supported. This is the quickest test of whether a reading is legitimate.
Pause and explain
How can branch rotation be used to check whether a conclusion is supported by a tree?
Check your reasoning after answering
Rotate the branches at a node and see whether the conclusion still holds. Rotation does not change the relationships the tree asserts, so any conclusion that depends on the original arrangement — such as a left-to-right ranking — is not supported.
Part 4 · Trees as hypotheses
A tree hypothesis is inferred from appropriate characters, sequences and models. Different datasets can disagree through limited information, gene-history differences, hybridization, errors or different assumptions. Evaluate sampling, homology, uncertainty and model fit rather than declare one disagreeing record worthless. A consensus or support measure also has a defined method and is not proof of certainty. Explain which relationship is supported and what new evidence would discriminate alternatives; do not present an unresolved node as an exactly known sequence of events.
Read the visual model
Identify the labeled structures and units, then trace the arrows or compare values under the caption’s stated conditions. Separate the displayed evidence from a further inference. Write your reasoning before opening the guidance.
What should be checked before treating dataset disagreement as proof that ancestry has no explanatory value?
Visual reasoning — after your attempt
Check character/sequence suitability, sampling, uncertainty and model assumptions; disagreement can guide a revised or more qualified hypothesis.
A tree is an inference from the characters used to build it, so it can be revised when characters are added or reinterpreted. Different datasets sometimes support different arrangements, and the honest presentation says which characters were used and how strongly they support each node rather than presenting one diagram as settled fact.
This is why sequence data changed so many trees: they added thousands of characters where anatomy offered dozens, and they are less vulnerable to independent origin of similar form. The appropriate confidence varies by node — some relationships are supported by every dataset, others remain unsettled — and a good tree reports that difference.
Pause and explain
Two datasets support different arrangements for one node. What is the appropriate way to report that node?
Check your reasoning after answering
State that the relationship at that node is unresolved, name the arrangements each dataset supports, and describe the evidence for each, rather than presenting one as established. Confidence should be reported per node, not for the tree as a whole.
Apply the whole unit · Build and critique a tree
Illustrative character matrix for four species and an outgroup, where 1 means the derived character is present. Characters: C1, C2, C3. Outgroup O: 0, 0, 0. Species Z: 1, 0, 0. Species W: 1, 1, 0. Species X: 1, 1, 1. Species Y: 1, 1, 1. All four species are living today.
Your task
Determine the branching order the matrix supports and state which character marks each node, explain why X and Y are the most closely related pair, and evaluate two claims a reader might make: that Y is the most evolved of the four, and that Z is the ancestor of the other three. Then state what additional data would best resolve the relationship between X and Y.
What your response should show
- Choose the appropriate biological model or relationship and state the conditions it assumes.
- Show the counts, rates, ratios, or intermediate reasoning the question requires.
- Use the supplied evidence to justify the conclusion and separate observation from inference.
- Identify a meaningful limitation, uncertainty, or next measurement.
Response guidance — after your attempt
Use the outgroup to identify derived states: O has none of the three characters, so 1 is the derived state in each case.
C1 is shared by Z, W, X and Y, so it marks the first node after the outgroup and groups all four together.
C2 is shared by W, X and Y but not Z, so Z branches off first and C2 marks the next node.
C3 is shared by X and Y only, so it marks the most recent node and unites that pair.
Branching order: O, then Z, then W, then X and Y as sister groups.
Evaluate the first claim: all four species are living, so none has evolved longer than another; Y's position reflects drawing order, and rotating branches at the X-Y node would put X on the right instead.
Evaluate the second claim: Z is a living species that branched earlier, not an ancestor; the ancestor at that node is extinct and is represented by the node itself, not by Z.
Resolve X and Y: the matrix gives no character separating them, so additional characters — ideally many molecular sites — are needed to determine whether they differ at all in branching position.
With the outgroup establishing 1 as the derived state, C1 unites all four species, C2 unites W, X and Y to the exclusion of Z, and C3 unites X and Y alone, giving the branching order O, then Z, then W, then X and Y as a sister pair. X and Y are the most closely related because they share the most recent node, marked by C3, and share every derived character the others have. Both reader claims fail. Y is not more evolved: all four species are living, so each lineage has had the same elapsed time since any common ancestor, and rotating the branches at the final node would place X in Y's position without changing a single relationship. Z is not an ancestor of the others either; it is a living species whose lineage separated earlier, and the ancestor at that node is extinct and represented by the node, not by any tip. The matrix provides no character distinguishing X from Y, so resolving their relationship — and testing whether they are even distinct lineages — requires many more characters, for which molecular sequence data are the practical source.
Scientific references and adapted source figures
Parent / teacher teaching notes
Branch rotation is the single most useful tool here: ask your child to redraw the tree with two branches swapped, and the "most evolved" reading collapses on its own. The living-tip point is worth stating plainly, since the idea that some living species are ancestors of others is both common and wrong. Building the tree from the character matrix by hand, using the outgroup to decide which state is derived, is what turns tree reading from pattern recognition into inference. Ask for an explanation of each label, arrow and axis before calculation. Keep first and revised models; attempt the changed case before consulting guidance. Distinguish invented instructional records from named historical sources. Source chromosome symbols are allele-category models, not DNA sequences. These independently authored high-school supplements are not the full OpenSciEd teacher editions or an endorsement.
The key idea
Read relationships from shared nodes and defined scales, then examine the evidence supporting them.
Worked examples
Example 1
- A and B meet at a node before their lineage joins C.
- Rotating A and B changes display order, not ancestry.
Example 2 · Worked application
- Trace common ancestors rather than tip spacing.
- A and B share the most recent common ancestor.
- Page arrangement can be rotated without altering those nodes.
A tree's topology carries relatedness; lengths need a declared scale.
Example 3
- Trace the shared ancestors rather than the page spacing.
- A and B share the most recent node.
Example 4 · Find and fix the mistake
- Test the claim against the stated conditions: A tree's topology carries relatedness; lengths need a declared scale.
- Tip position can change by rotating branches; shared nodes determine the represented relationship.
A tree's topology carries relatedness; lengths need a declared scale.
Example 5 · Reason from the visual evidence
- A branch metric may represent elapsed time, genetic change or another quantity when explicitly defined. Many classroom cladograms show topology only, so drawn horizontal distance cannot establish divergence dates or which lineage changed fastest. Missing lineages and unresolved nodes also limit interpretation. A long branch on an unscaled diagram is not evidence of greater complexity, age or survival value. Read the legend, rooting and sampling before attempting any quantitative relationship comparison.
- No. A dated or otherwise calibrated model and uncertainty are needed; topology alone supplies relative relationships.
Original unscaled cladogram; distances and node positions are intentionally not numerical age evidence.
Avoid these mistakes
- Tip order can change without changing the tree's relationships.
Check your understanding
In a tree, A and B share a recent node; C joins their branch at an older node. Which pair is most closely related?
Discuss the answer
A and B are the closest pair in the supplied tree.
Why does rotating a branch around its node not change relatedness?
Discuss the answer
Rotation changes the drawing’s tip order while preserving node connections and shared ancestry. Topology determines the relationship, not adjacent printed labels.
Return to the phenomenon
Return to the initial case. Why can two differently arranged tree drawings show the same ancestry? Revise your drawing or explanation using two named ideas and one stated limitation.
Compare explanations after your attempt
Shared nodes determine modeled relatedness; displayed order, progress rankings and unscaled distances do not.
What should we investigate next?
Which comparison would test a remaining uncertainty? State what you would change, keep comparable and measure.
Investigate, explain and revise
Complete these tasks after the teaching parts. Preserve your first model and a supported revision; use guidance after a real attempt.
Activity 1 · Return to the opening case
Use the opening question, defined terms, Parts 1–4 and your notebook. The supplied-data route needs no equipment or external account.
Your task
Return to the initial case. Why can two differently arranged tree drawings show the same ancestry? Revise your drawing or explanation using two named ideas and one stated limitation.
Success criteria
- Use relevant stated observations.
- Explain the mechanism with a labeled model.
- Distinguish quantities and assumptions.
- Describe a revision and a useful next test.
Hint
Follow objects, materials and information separately. Check what each measured quantity means.
Response guidance — discuss after your attempt
Shared nodes determine modeled relatedness; displayed order, progress rankings and unscaled distances do not.
Activity 2 · Transfer to a changed case
Cover the worked guidance and use the unit explanations/figures to solve a changed problem.
Your task
A rooted tree has topology ((A,B),C). A drawing is rotated to show B first, then A, then C. State the relationship and explain what is needed to estimate divergence time.
Success criteria
- Use the stated measurements or conditions, with correct units.
- Connect the result to the biological mechanism or evidence relationship.
- Identify the assumption, model limit or further evidence requested.
Hint
Name the stated conditions, select the relevant mechanism and show intermediate reasoning.
Response guidance — discuss after your attempt
A and B remain sister lineages in that topology. Tip order does not alter their shared ancestor; time estimation needs a specified calibrated branch metric/model and uncertainty.
Words to know
- node
- A branching point representing a common ancestor in a tree model.
- sister lineages
- Two lineages joined at their most recent shared node.
- derived feature
- A feature changed from the ancestral state used for comparison.
In the real world
Exit check
Name evidence that could strengthen a proposed tree.
Check your explanation after answering
Agreement among several independent anatomical features and appropriate molecular datasets, with uncertainty and alternative models considered.
Explain your reasoning without notes. If a key idea is missing, revisit the lesson and try again.
Problem 1
- A and B
- A and C
- B and C
- Every pair equally
Answer and explanation
A and B
A and B share the most recent node.
Problem 2
Answer and explanation
The diagram has not defined a time scale; length may be purely a layout choice.
Problem 3
Answer and explanation
Similar functions can evolve independently; multiple traits and sequence evidence help test relationships.
Problem 4
Answer and explanation
A and B are the closest pair in the supplied tree.
Trace the shared ancestors rather than the page spacing.
A and B share the most recent node.
Response criteria
- Use the stated conditions.
- Show the evidence or calculation.
- Explain the conclusion and any stated limitation.
Problem 5
Hints
A tree's topology carries relatedness; lengths need a declared scale.
Answer and explanation
No. The same branching connections remain.
Problem 6
Hints
State what the supplied observations or conditions establish, and separate that from any assumption.
Answer and explanation
No. Branch length represents time only when the diagram specifies that convention and scale.
Problem 7
Answer and explanation
No. A dated or otherwise calibrated model and uncertainty are needed; topology alone supplies relative relationships.
A branch metric may represent elapsed time, genetic change or another quantity when explicitly defined. Many classroom cladograms show topology only, so drawn horizontal distance cannot establish divergence dates or which lineage changed fastest. Missing lineages and unresolved nodes also limit interpretation. A long branch on an unscaled diagram is not evidence of greater complexity, age or survival value. Read the legend, rooting and sampling before attempting any quantitative relationship comparison.
No. A dated or otherwise calibrated model and uncertainty are needed; topology alone supplies relative relationships.
Response criteria
- Read the structures, axes, directions and units correctly.
- Connect the evidence with the biological mechanism.
- Respect stated model assumptions and distinguish an observation from a further inference.
Problem 8
Answer and explanation
A and B remain sister lineages in that topology. Tip order does not alter their shared ancestor; time estimation needs a specified calibrated branch metric/model and uncertainty.
A and B remain sister lineages in that topology. Tip order does not alter their shared ancestor; time estimation needs a specified calibrated branch metric/model and uncertainty.
Response criteria
- Use the stated measurements or conditions, with correct units.
- Connect the result to the biological mechanism or evidence relationship.
- Identify the assumption, model limit or further evidence requested.