Mendelian Genetics · Grade 10 Science
Chapter: DNA, Inheritance & Gene ExpressionMendelian Genetics
Learning goals
- I can use a Punnett square to predict the genotype and phenotype ratios of a monohybrid cross.
- I can express genetic outcomes as probabilities and combine them using the multiplication rule.
Readings for this unit
Before this unit
Use a probability grid and distinguish dominant from common.
Use three flexible study sessions: core explanation and Parts 1–2; Parts 3–4 with their reasoning checks and models; then the whole-unit application, worked examples, independent practice, and exit check. Allow about 50–60 minutes per session, including diagrams, data work, and notebook explanations. Attempt each check before opening its guidance. Schedule chapter investigations, review, and exams separately; add time where prerequisites are uncertain. Trace the explained visual parts and write a first model, then attempt the illustrated and changed independent cases. In the third session explain a correction and revise the opening account using evidence.
Start with something to explain
Why does a Punnett-square ratio fail to predict every small family exactly?
Illustrative evidence case. Gamete combinations define probabilities; finite samples fluctuate and dominant does not mean common.
Notice and wonder
Record two observations using the stated quantities or relationships. Keep observations separate from possible causes. Write one question that a new measurement could help answer.
Why does a Punnett-square ratio fail to predict every small family exactly?
Your first model
Draw gamete contributions and separate expected proportion from observed count.
Build the language from the idea
- allele
- A variant at a genetic locus.
- dominant
- Expressed in the heterozygote under a specified complete-dominance model; not necessarily common or beneficial.
- recessive
- Not expressed in the heterozygote’s modeled phenotype under complete dominance.
- homozygous
- Having the same allele at both copies of a diploid locus.
- heterozygous
- Having different alleles at a diploid locus.
- genotype
- The genetic variants specified for a locus or organism.
- phenotype
- A measured or observed characteristic influenced by genotype and context.
- Punnett square
- A probability model of gamete combinations under stated assumptions.
Mendelian models follow alleles through gametes and fertilization. At a stated diploid locus, homozygotes have matching alleles and heterozygotes have different alleles. Under complete dominance, the heterozygote has the modeled dominant phenotype. Dominance does not mean greater frequency or a better trait.
For Aa × Aa, independent equally likely gametes give expected genotypes AA, Aa, Aa, aa. Genotype probabilities are 1/4, 1/2, 1/4; under complete dominance the phenotype expectation is 3/4 dominant and 1/4 recessive. These are probabilities, not guaranteed counts in each small group.
Use known genotypes and a specified model. A test cross with aa can reveal a hidden recessive allele if an aa descendant appears under the model. All dominant descendants in a small sample do not prove the tested parent is AA. Human eye color and many other traits involve several genes; they should not be presented as literal one-gene examples.
A one-gene model can illustrate allele segregation when assumptions are explicit. Dominance describes how alleles relate to a phenotype in a heterozygote; it does not mean an allele is stronger, more common or beneficial. Use hypothetical traits rather than forcing complex human traits into this model.
A Punnett square describes probabilities for each offspring, not a required family composition. Four offspring do not have to include every predicted category once. Independent events can produce uneven small-sample counts.
Genotype and phenotype differ, and environment can affect expression. The model also assumes specified parental genotypes and a simple allele relationship. If those conditions are not met, more evidence is needed before calculating a trait probability.
Build your understanding
Use three flexible study sessions: core explanation and Parts 1–2; Parts 3–4 with their reasoning checks and models; then the whole-unit application, worked examples, independent practice, and exit check. Allow about 50–60 minutes per session, including diagrams, data work, and notebook explanations. Attempt each check before opening its guidance. Schedule chapter investigations, review, and exams separately; add time where prerequisites are uncertain.
Part 1 · Alleles, genotype, phenotype
An allele is a version at a genetic locus. Genotype records the relevant allele combination; phenotype is the measured characteristic under conditions. Complete dominance means the heterozygote matches one homozygous phenotype for the specified trait model. Dominant does not mean common, stronger, healthier or more fit in every environment. A one-locus two-allele model is useful for a constrained case, but complex traits can involve multiple genes and environmental effects. State the allele-to-phenotype relationship before reading the square.
Read the visual model
Identify the labeled structures and units, then trace the arrows or compare values under the caption’s stated conditions. Separate the displayed evidence from a further inference. Write your reasoning before opening the guidance.
Does a 3:1 phenotype prediction mean a dominant allele must be present in 75% of every population?
Visual reasoning — after your attempt
No. It is a probability prediction for this specified cross, not a population-frequency rule.
A gene occupies a position on a chromosome, and because chromosomes come in homologous pairs, a diploid organism carries two copies of each gene. Different versions of a gene are alleles. An organism with two identical alleles is homozygous; with two different alleles, heterozygous. The pair of alleles is the genotype; the observable characteristic is the phenotype.
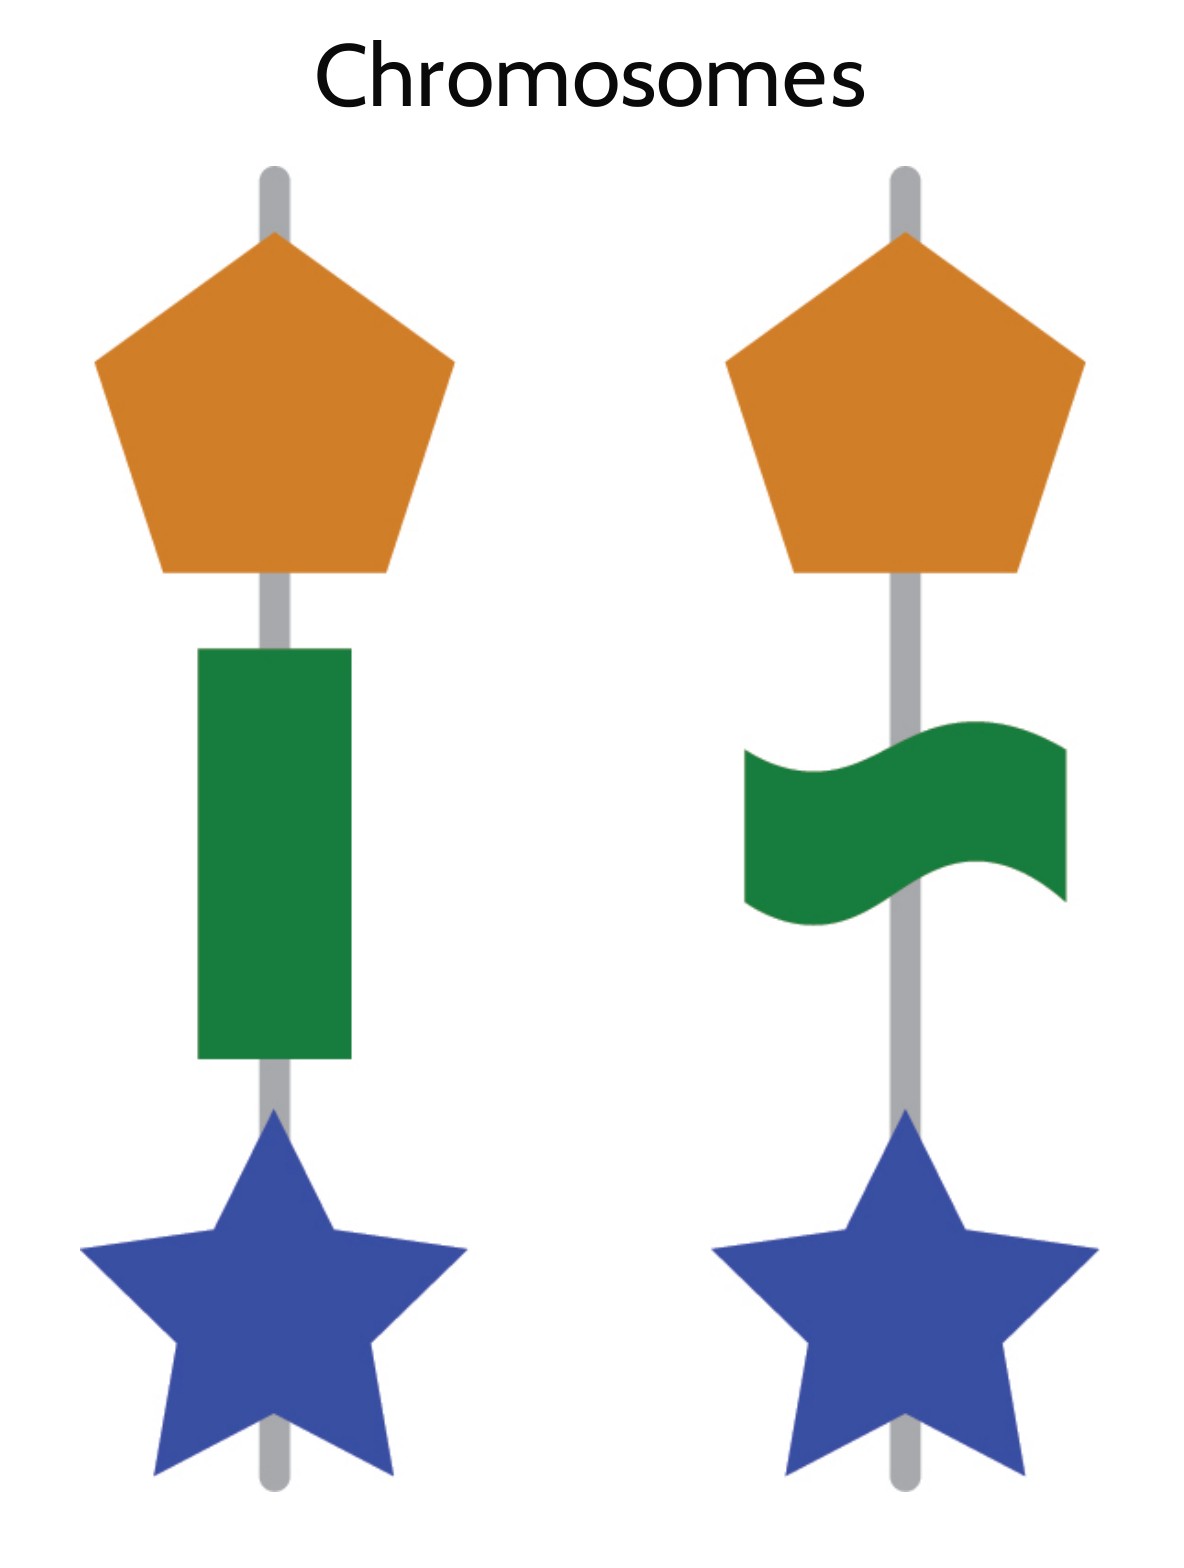
The relation between the two is the whole subject. When one allele is fully dominant, a heterozygote shows the same phenotype as a dominant homozygote, so two different genotypes produce one phenotype. That is why a phenotype does not reveal a genotype, and why inferring genotypes requires reasoning from crosses rather than from appearance.
Pause and explain
Why can you not read an individual's genotype from its dominant phenotype?
Check your reasoning after answering
Both a dominant homozygote and a heterozygote show the dominant phenotype, so the appearance is consistent with two different genotypes. Distinguishing them requires evidence from offspring, such as a test cross.
Part 2 · Why the ratios come out as they do
Segregation describes separation of allele copies with homologous chromosomes in the simple diploid model. A heterozygous parent supplies A or a gametes with equal probability under the stated assumptions; an aa parent supplies a. A Punnett square combines these contributions to predict genotype probabilities. The repeated column labels do not mean the second parent has more a alleles per gamete. Linkage, unequal gamete viability and other factors can change outcomes in more complex models.
Read the visual model
Identify the labeled structures and units, then trace the arrows or compare values under the caption’s stated conditions. Separate the displayed evidence from a further inference. Write your reasoning before opening the guidance.
Why do repeated a columns not mean an individual gamete contributes two a alleles?
Visual reasoning — after your attempt
Each cell combines one contribution from each parent; repeated columns display equivalent equally weighted possibilities.
Meiosis supplies the mechanism. A heterozygote's two alleles separate into different gametes, so half its gametes carry each allele. Combining gametes from two heterozygotes gives four equally likely pairings, which produce one dominant homozygote, two heterozygotes, and one recessive homozygote — a 1:2:1 genotype ratio and, with full dominance, a 3:1 phenotype ratio.
A Punnett square is simply a way of listing those pairings systematically. It is a probability table, not a prediction about a particular offspring, and its value lies in making the gamete combinations explicit. Drawing one correctly requires identifying each parent's gametes first, which is where most errors occur.
Pause and explain
Which event in meiosis accounts for a heterozygote producing two kinds of gamete in equal proportions?
Check your reasoning after answering
The separation of homologous chromosomes in meiosis I. The two alleles sit on homologous chromosomes, which separate into different cells, so half the gametes carry each allele.
Part 3 · Probability, not prophecy
A probability describes a model of possible outcomes, not a promised number in every small sample. For a recessive-category probability of 1/4 and 80 independent modeled offspring, the expected count is 20. Actual samples vary through chance, and unexpected counts require evaluation of sample size, model conditions and measurement rather than immediate rejection or certainty. Independent births in the model do not acquire a memory that forces the next child to balance earlier outcomes.
Read the visual model
Identify the labeled structures and units, then trace the arrows or compare values under the caption’s stated conditions. Separate the displayed evidence from a further inference. Write your reasoning before opening the guidance.
After three dominant-category outcomes, is a recessive-category fourth outcome guaranteed?
Visual reasoning — after your attempt
No. Each modeled independent outcome retains its probability; earlier outcomes do not force a balancing result.
A 3:1 expectation describes long-run proportions, and small samples depart from it routinely. Each conception is also independent: three recessive offspring in a row do not make a dominant offspring more likely next time, because which gametes meet is unaffected by previous events. The gambler's fallacy is the most common error in this unit and it is worth naming directly.
This also shapes how observed counts are judged. A Tt × Tt cross producing 140 dominant and 60 recessive out of 200 differs from the expected 150 and 50, but a deviation of that size arises from chance often enough that the data do not contradict the model. Deciding properly means asking how often chance alone would produce a deviation at least that large, rather than comparing the numbers by eye.
Pause and explain
A family of four children from a Tt × Tt cross shows no recessive phenotypes. Does this contradict the 3:1 expectation?
Check your reasoning after answering
No. The probability that all four show the dominant phenotype is (3/4)⁴, about 32 percent, so this outcome is common. Ratios describe expectations over large numbers, and a sample of four cannot test them.
Part 4 · Reasoning backwards from offspring
A test cross compares offspring under a specified mating and phenotype model to distinguish possible parental genotypes. If an A-category parent could be AA or Aa, crossing with aa predicts different outcomes. Observed aa supports the presence of a in the A-category parent under the model. Seeing no aa in a small sample does not prove AA, because an Aa parent could by chance yield only Aa. State parentage, penetrance, environment and sample assumptions before making a stronger inference.
Read the visual model
Identify the labeled structures and units, then trace the arrows or compare values under the caption’s stated conditions. Separate the displayed evidence from a further inference. Write your reasoning before opening the guidance.
Could an Aa×aa cross produce four Aa offspring by chance?
Visual reasoning — after your attempt
Yes. Under independent equal-probability outcomes the probability is (1/2)⁴=1/16, so absence of aa in four is not proof of AA.
The useful skill is inference: deducing genotypes from the phenotypes of parents and offspring. The strongest evidence comes from a recessive offspring, because it must have received a recessive allele from each parent. Two parents who both show the dominant phenotype and have a recessive child must therefore both be heterozygous.
A test cross formalizes the method. Crossing an individual of unknown genotype with a homozygous recessive produces recessive offspring only if the unknown parent carried a recessive allele, so a single recessive offspring settles the question. The absence of recessive offspring is weaker evidence, because a heterozygote can by chance produce none in a small number of offspring.
Pause and explain
A test cross produces 12 offspring, all showing the dominant phenotype. Is the tested parent homozygous dominant?
Check your reasoning after answering
Probably, but not certainly. A heterozygote would be expected to give about half recessive offspring, and the chance of 12 non-recessive offspring from a heterozygote is (1/2)¹², about one in 4,000 — unlikely but not impossible, so the conclusion is strong rather than proven.
Apply the whole unit · Infer genotypes from a breeding record
Illustrative breeding records for coat colour in a mammal, where dark coat is fully dominant over light. Cross 1: dark × light → 31 dark, 29 light. Cross 2: dark × dark → 44 dark, 16 light. Cross 3: light × light → 0 dark, 38 light.
Your task
Determine the genotypes of both parents in each cross and give the evidence for each determination, compare the observed counts with the expected ratios, and state which cross provides the strongest evidence about its parents' genotypes. Then explain what Cross 3 would have implied if even one dark offspring had appeared.
What your response should show
- Choose the appropriate biological model or relationship and state the conditions it assumes.
- Show the counts, rates, ratios, or intermediate reasoning the question requires.
- Use the supplied evidence to justify the conclusion and separate observation from inference.
- Identify a meaningful limitation, uncertainty, or next measurement.
Response guidance — after your attempt
Cross 1: roughly half the offspring are light, which is the expectation for a heterozygous dark parent crossed with a light homozygote, so the parents are Dd × dd; the observed 31:29 is close to the expected 30:30.
Cross 2: light offspring appear from two dark parents, so each dark parent must carry a recessive allele and both are Dd; the expected 3:1 ratio for 60 offspring is 45 dark and 15 light, against the observed 44 and 16.
Cross 3: both parents show the recessive phenotype, so both must be dd, and all offspring are necessarily dd — consistent with the 38 light and 0 dark observed.
Judge the evidence: Cross 2 is the most informative, because the appearance of any light offspring from two dark parents proves both parents heterozygous in a single observation.
Note Cross 1's role: it functions as a test cross, so its light offspring also establish the dark parent as heterozygous.
Consider the alternative for Cross 3: a single dark offspring from two light parents would contradict the assumption that dark is fully dominant over light, pointing instead to a mutation, a misidentified parent, or a more complex inheritance pattern than one gene with two alleles.
Cross 1 is Dd × dd: the roughly equal split of 31 dark to 29 light matches the 1:1 expectation and the light offspring establish that the dark parent carries a recessive allele. Cross 2 is Dd × Dd, proved by the appearance of light offspring from two dark parents, and the observed 44:16 is close to the expected 45:15. Cross 3 must be dd × dd, since both parents show the recessive phenotype, and all 38 offspring being light is the only possible outcome. Cross 2 gives the strongest evidence, because one light offspring from two dark parents settles both parents' genotypes at once, whereas an absence of recessive offspring would have left the question open. Had a single dark offspring appeared in Cross 3, the assumption of simple dominance would be in doubt: a new mutation, a misrecorded or mistaken parent, or an inheritance pattern involving more than one gene would each have to be considered, and the record alone could not distinguish them.
Scientific references and adapted source figures
- OpenSciEd 8.5 — genetics foundations and case models
- OpenSciEd middle-school source license — CC BY 4.0
Parent / teacher teaching notes
Require the gametes to be written out before any Punnett square is drawn; nearly every error in this unit comes from entering genotypes rather than gametes along the edges. The gambler's fallacy deserves to be raised explicitly, because it feels right to almost everyone. When comparing observed counts with expected ratios, resist both overconfident conclusions — a close match is not proof, and a modest deviation is not refutation — which is also the honest position the data support. Ask for an explanation of each label, arrow and axis before calculation. Keep first and revised models; attempt the changed case before consulting guidance. Distinguish invented instructional records from named historical sources. Source chromosome symbols are allele-category models, not DNA sequences. These independently authored high-school supplements are not the full OpenSciEd teacher editions or an endorsement.
An interactive Punnett square showing a cross between two parents, filling a 2x2 grid with the offspring allele combinations.
The key idea
Punnett squares predict probabilities under specified inheritance assumptions; samples can vary and many traits need more complex models.
Monohybrid Cross Ratio (Bb x Bb)
1 BB : 2 Bb : 1 bb → 3 dominant : 1 recessive
both parents are heterozygous (Bb) for a trait with simple dominant/recessive inheritance.
Multiplication Rule for Probability
P(A and B) = P(A) x P(B)
combining the probabilities of independent events, such as two separate offspring or two unlinked genes.
Worked examples
Example 1
- Set up the 2x2 square with P and p from each parent. The four boxes are PP, Pp, Pp, pp.
- Genotypes: one PP, two Pp, one pp — a 1:2:1 ratio.
- Phenotypes: PP, Pp, and Pp all show purple (P is dominant); only pp is white — a 3:1 ratio.
Example 2 · Worked application
- Aa produces A and a gametes equally; aa produces a.
- Offspring are half Aa and half aa.
- Aa shows the dominant phenotype under the model.
Probabilities describe many outcomes, not a guaranteed pattern in every small family.
Example 3
- From a Bb x Bb square (BB, Bb, Bb, bb), one of the four boxes is bb, so P(bb) = 1/4 for each child.
- Each birth is an independent event, so multiply the probabilities together.
- P(three bb in a row) = 1/4 x 1/4 x 1/4 = 1/64.
Example 4
- Each parent contributes A or a with probability one half.
- The four equally likely combinations are AA, Aa, aA and aa.
Example 5 · Find and fix the mistake
- Test the claim against the stated conditions: Probabilities describe many outcomes, not a guaranteed pattern in every small family.
- Each conception is a separate probability event under the model; small samples vary.
Probabilities describe many outcomes, not a guaranteed pattern in every small family.
Example 6 · Reason from the visual evidence
- A probability describes a model of possible outcomes, not a promised number in every small sample. For a recessive-category probability of 1/4 and 80 independent modeled offspring, the expected count is 20. Actual samples vary through chance, and unexpected counts require evaluation of sample size, model conditions and measurement rather than immediate rejection or certainty. Independent births in the model do not acquire a memory that forces the next child to balance earlier outcomes.
- No. Each modeled independent outcome retains its probability; earlier outcomes do not force a balancing result.
Original simulated family counts, not real breeding data or personal reproductive predictions.
Avoid these mistakes
- A 25% probability does not guarantee exactly one affected child in every four births.
Check your understanding
In a hypothetical complete-dominance model, cross Aa with Aa. Find genotype probabilities.
Discuss the answer
¼ AA, ½ Aa and ¼ aa; each offspring is a new probability event.
Why does dominant not mean common in a population?
Discuss the answer
Dominance describes a particular heterozygote phenotype mapping, not allele frequency, benefit or strength. Population abundance depends on history and several evolutionary processes.
Return to the phenomenon
Return to the initial case. Why does a Punnett-square ratio fail to predict every small family exactly? Revise your drawing or explanation using two named ideas and one stated limitation.
Compare explanations after your attempt
Allele segregation and the stated phenotype model support probabilities, while sampling and biological conditions limit certainty.
What should we investigate next?
Which comparison would test a remaining uncertainty? State what you would change, keep comparable and measure.
Investigate, explain and revise
Complete these tasks after the teaching parts. Preserve your first model and a supported revision; use guidance after a real attempt.
Activity 1 · Return to the opening case
Use the opening question, defined terms, Parts 1–4 and your notebook. The supplied-data route needs no equipment or external account.
Your task
Return to the initial case. Why does a Punnett-square ratio fail to predict every small family exactly? Revise your drawing or explanation using two named ideas and one stated limitation.
Success criteria
- Use relevant stated observations.
- Explain the mechanism with a labeled model.
- Distinguish quantities and assumptions.
- Describe a revision and a useful next test.
Hint
Follow objects, materials and information separately. Check what each measured quantity means.
Response guidance — discuss after your attempt
Allele segregation and the stated phenotype model support probabilities, while sampling and biological conditions limit certainty.
Activity 2 · Transfer to a changed case
Cover the worked guidance and use the unit explanations/figures to solve a changed problem.
Your task
Under complete dominance, Aa×aa produces independent offspring with equal genotype probabilities. Find the expected aa count among 60 and the probability that the first three are all Aa.
Success criteria
- Use the stated measurements or conditions, with correct units.
- Connect the result to the biological mechanism or evidence relationship.
- Identify the assumption, model limit or further evidence requested.
Hint
Name the stated conditions, select the relevant mechanism and show intermediate reasoning.
Response guidance — discuss after your attempt
Expected aa count is 60×1/2=30. The probability of three Aa outcomes is (1/2)³=1/8. Neither expectation forces a specific finite family outcome.
Words to know
- allele
- A variant at a genetic locus.
- dominant
- Expressed in the heterozygote under a specified complete-dominance model; not necessarily common or beneficial.
- recessive
- Not expressed in the heterozygote’s modeled phenotype under complete dominance.
- homozygous
- Having the same allele at both copies of a diploid locus.
- heterozygous
- Having different alleles at a diploid locus.
- genotype
- The genetic variants specified for a locus or organism.
- phenotype
- A measured or observed characteristic influenced by genotype and context.
- Punnett square
- A probability model of gamete combinations under stated assumptions.
The monk whose peas waited 35 years
In a monastery garden in the 1860s, Gregor Mendel cross-bred thousands of pea plants and tracked traits like seed color and plant height across generations. His careful counting revealed the predictable ratios that Punnett squares now model — yet almost no one noticed. His work was essentially ignored until around 1900, when several scientists independently rediscovered the same patterns and realized Mendel had solved the puzzle decades earlier.
Beyond simple dominance
Not every trait obeys clean dominant-and-recessive rules. In incomplete dominance, neither allele fully wins and the heterozygote is a blend — a red snapdragon crossed with a white one gives pink. In codominance, both alleles show fully and separately at once — a person with type AB blood displays both the A and the B markers, and some cattle have coats with distinct patches of both red and white hair.
Most traits use many genes
Textbook one-gene examples are the simplest case. Most human traits — height, skin color, and much of eye color — are polygenic, shaped by many genes acting together, which is why they vary along a smooth range instead of falling into a few neat categories. Some genes also have multiple alleles in the population: the ABO blood group is controlled by a single gene with three different alleles, not just two.
Traits that ride on the X chromosome
Genes located on the X chromosome, such as those for red-green colorblindness and hemophilia, show a distinctive inheritance pattern. Because males have only one X, a single recessive allele there is enough to show the trait, while females (with two X's) would need two copies. This is why these sex-linked conditions appear far more often in males and can seem to 'skip' generations, passing silently through carrier mothers.
Probability, not prophecy
A predicted 3:1 ratio is an average over many offspring, not a promise about any small family — much like flipping a coin four times won't reliably give exactly two heads. Only across large numbers do the ratios become dependable (the law of large numbers). This is the same math genetic counselors use with real families: two carriers of a recessive condition face a 1-in-4 risk per child, every pregnancy, regardless of how previous ones turned out.
In the real world
Genetic counselors use exactly this Punnett-square math to tell prospective parents their chance of passing on a recessive condition such as cystic fibrosis — when both parents are carriers, the risk is the familiar 1 in 4 per child.
Exit check
Does a 25% predicted recessive probability guarantee one recessive offspring in every four?
Check your explanation after answering
No. It is an expected probability under the model; independent outcomes fluctuate, especially in small samples.
Explain your reasoning without notes. If a key idea is missing, revisit the lesson and try again.