DNA, Inheritance & Gene Expression — Print · Life Science: Biology, Grade 10
Use DNA and inheritance models while testing their limits with expression and variation evidence.
Printable chapter lessons and review.
DNA Structure & Replication
Learning goals
- I can describe the structure of DNA, including the double helix and complementary base pairing (A-T, C-G).
- I can explain how semiconservative replication copies DNA so each new molecule keeps one original strand and one new strand.
Readings for this unit
Before this unit
Pair complementary bases and distinguish strands from chromosomes.
Use three flexible study sessions: core explanation and Parts 1–2; Parts 3–4 with their reasoning checks and models; then the whole-unit application, worked examples, independent practice, and exit check. Allow about 50–60 minutes per session, including diagrams, data work, and notebook explanations. Attempt each check before opening its guidance. Schedule chapter investigations, review, and exams separately; add time where prerequisites are uncertain. Trace the explained visual parts and write a first model, then attempt the illustrated and changed independent cases. In the third session explain a correction and revise the opening account using evidence.
Start with something to explain
How can DNA be copied without losing the old template information?
Illustrative evidence case. Complementary, antiparallel strands serve as templates for new partners; correction limits but does not eliminate errors.
Notice and wonder
Record two observations using the stated quantities or relationships. Keep observations separate from possible causes. Write one question that a new measurement could help answer.
How can DNA be copied without losing the old template information?
Your first model
Label base pairing, backbone direction and old/new strand origin.
Build the language from the idea
- nucleotide
- The building block of DNA, made of a sugar, a phosphate group, and one of four nitrogen bases (A, T, C, or G).
- double helix
- The twisted-ladder shape of a DNA molecule, formed by two strands winding around each other.
- complementary base pairing
- The rule that adenine always pairs with thymine (A-T) and cytosine always pairs with guanine (C-G).
- semiconservative replication
- The way DNA copies itself so that each new double helix keeps one original strand and one newly built strand.
- DNA polymerase
- The enzyme that builds a new DNA strand by adding matching nucleotides one at a time along a template strand.
- antiparallel
- The two paired DNA backbones run in opposite 5′/3′ chemical directions.
- semiconservative
- Each copied duplex retains an original strand and gains a new complementary strand in the standard model.
Inside almost every one of your cells sits a molecule with a nearly impossible job: storing the complete instructions for building and running a human being, written in a code so compact that the DNA from a single cell would stretch about two meters if you unwound it, yet folds up small enough to vanish inside a nucleus. The secret to that density — and to nearly everything DNA does — is its elegant structure. DNA is built from small repeating units called nucleotides, each one a set of three parts: a sugar, a phosphate group, and one of just four nitrogen bases, abbreviated A, T, C, and G.
Link many nucleotides together and you get a single strand; bring two strands together and they twist into DNA's famous double helix — the shape of a ladder gently spiraled around its own length. The two outer rails of that ladder are an alternating sugar-and-phosphate backbone, sturdy and repetitive, while the rungs are where the information actually lives. Each rung is a pair of bases reaching toward each other from opposite strands, and here is the crucial rule: the pairing is never random. Adenine always bonds with thymine (A-T), and cytosine always bonds with guanine (C-G) — a principle called complementary base pairing.
That one rule turns out to be the key to the whole molecule. Because A only fits T and C only fits G, the two strands are not identical but *complementary* — each is a kind of mirror image of the other. If you know the sequence of one strand, you automatically know the sequence of its partner: read one strand as A-T-G-C and its partner must read T-A-C-G. In effect, nature stores every gene twice over in matched form, and that built-in redundancy is exactly what makes DNA so easy to copy without losing information.
Copying happens every time a cell prepares to divide, in a process called semiconservative replication. First the double helix unzips down the middle, breaking the weak bonds between the paired bases and separating the two strands like a zipper. Each exposed strand then serves as a template: an enzyme called DNA polymerase moves along it and adds free-floating nucleotides one by one, always obeying the pairing rule — slotting a T opposite every A, a G opposite every C. By the time it finishes, each old strand has a brand-new partner strand built alongside it.
The result is two complete double helices where there was one, and each of them is half old and half new: one original strand conserved, one freshly assembled. (That 'half-conserved' detail is why the process is called *semi*conservative, and a famous 1958 experiment confirmed it.) Copying this way is astonishingly accurate — DNA polymerase even proofreads its own work, catching most mistakes as it goes. But 'most' is not 'all,' and a rare uncorrected error — a wrong base slipped into the sequence — is one important source of the mutations that ultimately make every organism genetically unique.
DNA's complementary base pairing supports copying: each original strand can guide synthesis of a new complementary strand. The process is semiconservative in the standard model, leaving each new double helix with one old and one new strand.
Replication accuracy depends on enzymes, proofreading and repair. A copying error that escapes correction can become a mutation, but not every DNA damage event becomes a permanent inherited change. Distinguish a temporary lesion from a stable sequence change.
A chromosome contains a long DNA molecule with associated proteins and many functional regions. A gene is not an entire chromosome, and not all DNA codes for protein. Use scale and organization clearly when moving between bases, genes and chromosomes.
Build your understanding
Use three flexible study sessions: core explanation and Parts 1–2; Parts 3–4 with their reasoning checks and models; then the whole-unit application, worked examples, independent practice, and exit check. Allow about 50–60 minutes per session, including diagrams, data work, and notebook explanations. Attempt each check before opening its guidance. Schedule chapter investigations, review, and exams separately; add time where prerequisites are uncertain.
Part 1 · A ladder with a rule
A DNA nucleotide includes a sugar, phosphate and base. Complementary pairing links A with T and G with C in the ordinary DNA model. Antiparallel means the backbones run in opposite chemical directions, labeled 5′ and 3′ according to sugar positions, not page coordinates. Hydrogen bonds between bases differ from covalent backbone connections. A flattened ladder makes pairing readable but does not show the full helical geometry or molecular flexibility. Sequence direction must be preserved when constructing or comparing complements.
Read the visual model
Identify the labeled structures and units, then trace the arrows or compare values under the caption’s stated conditions. Separate the displayed evidence from a further inference. Write your reasoning before opening the guidance.
What is the paired sequence beneath 5′-ATGCAT-3′ when written directly opposite?
Visual reasoning — after your attempt
3′-TACGTA-5′, antiparallel to the supplied strand.
DNA is a polymer of nucleotides, each made of a sugar, a phosphate group, and one of four nitrogenous bases: adenine, thymine, guanine, cytosine. The sugar and phosphate units link into a backbone, and the bases project inward. Two such strands wind around each other, held together by hydrogen bonds between paired bases, with the two backbones running in opposite directions.
The pairing is specific: adenine with thymine, guanine with cytosine. That single rule explains the structure's most important property. Because each base admits only one partner, either strand specifies the other completely, so the molecule carries a built-in template for its own reconstruction. The information is in the sequence of bases; the backbone is identical all the way along.
Pause and explain
Why does the sequence of bases carry the information rather than the sugar-phosphate backbone?
Check your reasoning after answering
The backbone is the same repeating unit along the whole strand, so it cannot distinguish one region from another. Only the order of the four bases varies, so only that order can encode anything.
Part 2 · The evidence behind the model
A structural model proposes how components are arranged. Chemical composition, base ratios and diffraction patterns helped constrain DNA’s double-helical explanation; an image pattern is not itself a direct photograph of every base. Independent evidence checks different predictions, such as pairing and backbone organization. Credit the observations and model-building contributions rather than treating a memorable sketch as discovery by one person alone. A good model can be revised in detail while retaining relationships supported by multiple tests.
Read the visual model
Identify the labeled structures and units, then trace the arrows or compare values under the caption’s stated conditions. Separate the displayed evidence from a further inference. Write your reasoning before opening the guidance.
Why is a drawing of a helix not by itself proof of DNA structure?
Visual reasoning — after your attempt
A drawing is a proposal; chemical and structural measurements must support its predictions and rule out alternatives.
The double helix was inferred rather than seen. X-ray diffraction images, principally those produced by Rosalind Franklin and Raymond Gosling, indicated a helical molecule with a regular repeat and a measurable diameter — too uniform to be a structure with variably sized pairs on the inside. Separately, Erwin Chargaff's measurements showed that in a given species the amount of adenine equals that of thymine and guanine equals cytosine.
Watson and Crick's model accounted for both results at once: a large base paired with a small one in each rung keeps the diameter constant, and specific A-T and G-C pairing produces exactly Chargaff's equalities. This is a clear case of a model being accepted because it explained several independent measurements, not because the structure had been observed directly.
Pause and explain
Why would pairing adenine with guanine be inconsistent with the diffraction evidence?
Check your reasoning after answering
Both are large bases, so such a rung would be wider than one pairing a large base with a small one. The images showed a constant diameter, which requires every rung to be the same width — one large base with one small one.
Part 3 · Semiconservative replication
Semiconservative replication produces two duplexes, each with an original template strand and a newly synthesized partner in the basic model. Strand separation exposes templates, and pairing constrains new sequence. DNA polymerase builds in the 5′→3′ direction, with additional enzymes and mechanisms supporting copying and ligation. Replication is not splitting each base in half or preserving an entirely old double helix beside an entirely new one. One old strand per product is the central inheritance pattern; actual forks involve more detailed leading/lagging behavior.
Read the visual model
Identify the labeled structures and units, then trace the arrows or compare values under the caption’s stated conditions. Separate the displayed evidence from a further inference. Write your reasoning before opening the guidance.
After one ideal round, does either product contain two entirely old strands?
Visual reasoning — after your attempt
No. Each has one old and one new strand under the semiconservative model.
Replication begins with the two strands separating. Each then serves as a template: free nucleotides pair with the exposed bases, and an enzyme joins them into a continuous new strand. The result is two double helices, each containing one original strand and one newly made one — which is what semiconservative means.
The phrase matters because two alternatives were plausible before the experiments. Replication might have produced one entirely original molecule and one entirely new one, or might have broken and recombined the strands throughout. Labelling the original strands with a heavier isotope and following them into the products distinguished the possibilities, and the observed pattern matched the semiconservative prediction.
Pause and explain
After one round of replication, how many of the four strands present are original, and in which molecules?
Check your reasoning after answering
Two of the four are original, and they are in different molecules — one in each product. Each double helix therefore has one original and one new strand, which is the semiconservative outcome.
Part 4 · Accuracy, errors, and why both matter
A mismatch is an inappropriate pairing in a copying event; a lasting mutation is a sequence change retained after the relevant processes. Proofreading and repair reduce errors, but no simplified model guarantees every sequence is copied perfectly. A percentage of mismatches among copied bases differs from the number of cells carrying a mutation or its phenotypic effect. Specify the denominator, correction stage and sampling method. Mutation effects depend on location, gene regulation, protein changes and environment rather than a universal beneficial/harmful label.
Read the visual model
Identify the labeled structures and units, then trace the arrows or compare values under the caption’s stated conditions. Separate the displayed evidence from a further inference. Write your reasoning before opening the guidance.
Do ten initial mismatches necessarily establish ten permanent trait changes?
Visual reasoning — after your attempt
No. Repair, inheritance, location and expression affect whether an error persists and changes a measured trait.
Replication is extremely accurate but not perfect. Incorrect bases are occasionally inserted, and repair mechanisms detect and correct most of them; those that remain are mutations. Because replication precedes every cell division, an uncorrected error in a dividing cell is passed to all its descendants, which is why checkpoint control and repair matter so much.
Both the accuracy and the residual error rate are biologically necessary. High accuracy keeps genetic information stable across generations of cells and organisms; the small error rate is one source of the heritable variation on which natural selection acts. Describing mutation as simply damage misses the second half of that account.
Pause and explain
Why is a replication error in a cell that will divide many times more consequential than one in a cell that will not divide again?
Check your reasoning after answering
Every descendant of a dividing cell inherits the error, so a single mistake can be multiplied into a large population of altered cells. In a cell that will not divide, the error affects only that cell.
Apply the whole unit · Reconstruct a strand and audit a composition
Illustrative data for a double-stranded DNA sample. Measured composition: cytosine 22 percent. A fragment of one strand reads 5'-TTACGGCAT-3'. The sample is reported to have replicated twice in a labelling experiment that marked the original strands.
Your task
Calculate the percentages of guanine, adenine, and thymine and state the rule each step uses, write the complementary sequence for the fragment, and determine how many of the strands present after two rounds of replication are original. Then explain what result would have shown that replication is not semiconservative.
What your response should show
- Choose the appropriate biological model or relationship and state the conditions it assumes.
- Show the counts, rates, ratios, or intermediate reasoning the question requires.
- Use the supplied evidence to justify the conclusion and separate observation from inference.
- Identify a meaningful limitation, uncertainty, or next measurement.
Response guidance — after your attempt
Guanine: G pairs with C, so G = 22 percent.
Remaining: C and G together are 44 percent, so A and T together are 100 − 44 = 56 percent.
Adenine and thymine: A pairs with T, so each is 56 / 2 = 28 percent.
Complement of 5'-TTACGGCAT-3': pair each base, giving 3'-AATGCCGTA-5', which read in the standard direction is 5'-ATGCCGTAA-3'.
Strands after two rounds: one molecule becomes four, so 8 strands exist; only the 2 original strands are old, and they lie in two different molecules.
A non-semiconservative result: finding molecules made of two original strands alongside molecules of two new strands after one round would indicate conservative replication, while finding every strand to be a patchwork of old and new segments would indicate dispersive replication.
With cytosine at 22 percent, guanine is also 22 percent because the two pair, leaving 56 percent to be divided equally between adenine and thymine at 28 percent each. The complement of 5'-TTACGGCAT-3' is 5'-ATGCCGTAA-3', obtained by pairing each base and reading the new strand in the opposite orientation, since the two backbones run in opposite directions. After two rounds of replication the original molecule has become four, so eight strands exist, of which only the two originals are old and they sit in separate molecules — each of the other two molecules is entirely new. The semiconservative claim would have been refuted by either of two outcomes: molecules of two original strands appearing alongside wholly new molecules after one round, which is conservative replication, or every strand turning out to be a mixture of old and new segments, which is dispersive replication. The labelling experiment matters precisely because the structure alone does not decide between these.
Scientific references and adapted source figures
Parent / teacher teaching notes
The Chargaff arithmetic is the quickest reliable check on whether base pairing has been understood, and it is worth repeating with several starting percentages until it is automatic. Insist on the complement being written with its direction, since reading a strand backwards is the usual source of wrong answers. The semiconservative point rewards a minute of attention to the alternatives: students who can state what conservative and dispersive replication would have looked like understand why an experiment was needed at all. Ask for an explanation of each label, arrow and axis before calculation. Keep first and revised models; attempt the changed case before consulting guidance. Distinguish invented instructional records from named historical sources. Source chromosome symbols are allele-category models, not DNA sequences. These independently authored high-school supplements are not the full OpenSciEd teacher editions or an endorsement.
A rotating double-helix model of DNA showing its twisted-ladder shape, with paired bases forming the rungs.
The key idea
DNA is a double helix of nucleotides whose bases pair by a strict rule (A-T, C-G); this complementary pairing lets DNA copy itself semiconservatively, so each new molecule keeps one original strand and one new one.
Chargaff's Rules
%A = %T, %G = %C, and A + T + G + C = 100%
any sample of double-stranded DNA, because the bases pair A-T and C-G.
Worked examples
Example 1
- Apply the pairing rule to each base: A pairs with T, and C pairs with G (and the reverse).
- Go base by base: A to T, T to A, G to C, C to G, C to G, G to C, T to A, A to T.
- Read the new bases off in the same order.
Example 2 · Worked application
- Use A–T and C–G pairing: TGCA.
- Replication separates parental strands and makes a new complement for each.
- Each daughter double helix contains one old and one new strand.
Pairing rules provide a template mechanism; sequence order still matters.
Example 3
- Because A always pairs with T, the amount of thymine equals the amount of adenine: T = 30%.
- Together, A and T make up 30% + 30% = 60% of the bases, leaving 40% for C and G combined.
- Because C always pairs with G, that 40% splits evenly between them: G = 20% (and C = 20%).
Example 4
- A pairs with T and C with G.
- Apply the rule to each position in the supplied order.
Example 5 · Find and fix the mistake
- Test the claim against the stated conditions: Pairing rules provide a template mechanism; sequence order still matters.
- Semiconservative replication retains one parental strand in each daughter double helix.
Pairing rules provide a template mechanism; sequence order still matters.
Example 6 · Reason from the visual evidence
- Semiconservative replication produces two duplexes, each with an original template strand and a newly synthesized partner in the basic model. Strand separation exposes templates, and pairing constrains new sequence. DNA polymerase builds in the 5′→3′ direction, with additional enzymes and mechanisms supporting copying and ligation. Replication is not splitting each base in half or preserving an entirely old double helix beside an entirely new one. One old strand per product is the central inheritance pattern; actual forks involve more detailed leading/lagging behavior.
- No. Each has one old and one new strand under the semiconservative model.
Original strand-origin and pairing comparison. Colors identify strand history, not different base chemicals or all replication-fork proteins.
Avoid these mistakes
- DNA replication does not make a second strand identical to its complementary partner.
Check your understanding
An original DNA strand has bases A-C-G-T. Give its complementary sequence and explain the pairing rule.
Discuss the answer
T-G-C-A in corresponding paired positions; actual strands have opposite orientation.
What does semiconservative replication preserve in each daughter DNA molecule?
Discuss the answer
Each copied duplex retains an original template strand and gains a complementary newly synthesized partner in the standard semiconservative model.
Return to the phenomenon
Return to the initial case. How can DNA be copied without losing the old template information? Revise your drawing or explanation using two named ideas and one stated limitation.
Compare explanations after your attempt
Semiconservative copying preserves an old strand in each duplex; sequence direction and repair stages matter for the inheritance account.
What should we investigate next?
Which comparison would test a remaining uncertainty? State what you would change, keep comparable and measure.
Investigate, explain and revise
Complete these tasks after the teaching parts. Preserve your first model and a supported revision; use guidance after a real attempt.
Activity 1 · Return to the opening case
Use the opening question, defined terms, Parts 1–4 and your notebook. The supplied-data route needs no equipment or external account.
Your task
Return to the initial case. How can DNA be copied without losing the old template information? Revise your drawing or explanation using two named ideas and one stated limitation.
Success criteria
- Use relevant stated observations.
- Explain the mechanism with a labeled model.
- Distinguish quantities and assumptions.
- Describe a revision and a useful next test.
Hint
Follow objects, materials and information separately. Check what each measured quantity means.
Response guidance — discuss after your attempt
Semiconservative copying preserves an old strand in each duplex; sequence direction and repair stages matter for the inheritance account.
Activity 2 · Transfer to a changed case
Cover the worked guidance and use the unit explanations/figures to solve a changed problem.
Your task
Write the complementary strand opposite 5′-AACGTT-3′, then explain strand origin after one semiconservative round.
Success criteria
- Use the stated measurements or conditions, with correct units.
- Connect the result to the biological mechanism or evidence relationship.
- Identify the assumption, model limit or further evidence requested.
Hint
Name the stated conditions, select the relevant mechanism and show intermediate reasoning.
Response guidance — discuss after your attempt
The directly paired complement is 3′-TTGCAA-5′. Each resulting duplex has one old template strand and one newly synthesized partner in the ideal model.
Words to know
- nucleotide
- The building block of DNA, made of a sugar, a phosphate group, and one of four nitrogen bases (A, T, C, or G).
- double helix
- The twisted-ladder shape of a DNA molecule, formed by two strands winding around each other.
- complementary base pairing
- The rule that adenine always pairs with thymine (A-T) and cytosine always pairs with guanine (C-G).
- semiconservative replication
- The way DNA copies itself so that each new double helix keeps one original strand and one newly built strand.
- DNA polymerase
- The enzyme that builds a new DNA strand by adding matching nucleotides one at a time along a template strand.
- antiparallel
- The two paired DNA backbones run in opposite 5′/3′ chemical directions.
- semiconservative
- Each copied duplex retains an original strand and gains a new complementary strand in the standard model.
The experiment that proved 'semiconservative'
When Watson and Crick proposed the double helix in 1953, they noted it 'immediately suggests a possible copying mechanism' — but three competing ideas about how DNA copies remained. In 1958, Matthew Meselson and Franklin Stahl settled it: they grew bacteria in 'heavy' nitrogen, switched them to 'light' nitrogen, and measured the density of the DNA after each round of copying. After one round, every molecule was exactly intermediate — one heavy (old) strand and one light (new) strand — proving replication is semiconservative. It's often called 'the most beautiful experiment in biology.'
Rosalind Franklin and Photo 51
The famous double-helix model leaned heavily on an X-ray diffraction image known as Photo 51, produced using techniques perfected by Rosalind Franklin. Her crisp diffraction pattern revealed DNA's helical shape and dimensions. Franklin died of cancer in 1958, before the 1962 Nobel Prize honored the discovery; because Nobel Prizes are not awarded posthumously, her essential contribution went unrecognized by that award.
The strands run in opposite directions
The two strands of DNA are not only complementary, they are antiparallel — they run in opposite directions, one oriented 5' to 3' and the other 3' to 5'. This matters because DNA polymerase can only build a new strand in one direction. As a result, one new strand is made smoothly and continuously while the other has to be built in short, backward pieces that are later stitched together — a surprising complication hidden inside the tidy 'unzip and copy' picture.
Why chromosome ends need caps
Because of how replication works, the machinery can't quite finish copying the very tips of a chromosome, so a little is lost each time. To protect the important genes, chromosomes end in repetitive, non-coding caps called telomeres — like the plastic tips on shoelaces. Telomeres get slightly shorter with every division, and once they wear down too far, the cell stops dividing. This ties DNA structure directly to aging and to how cells 'count' their divisions.
One typo, enormous consequences
Not every mutation is a sweeping change — some of the most significant involve a single wrong letter out of billions. Sickle-cell disease results from one base change in the gene for hemoglobin, the oxygen-carrying protein in red blood cells. That single substitution makes the cells collapse into a rigid, sickle shape that can jam narrow blood vessels. It's a vivid reminder that because DNA is read so precisely, a change to even one nucleotide can ripple out to affect an entire body.
In the real world
The copy-from-a-template logic of DNA replication is the basis of PCR, the lab technique used to amplify tiny DNA samples for COVID-19 tests, forensic 'DNA fingerprinting' at crime scenes, and at-home ancestry kits.
Exit check
Why can either DNA strand serve as a copying template?
Check your explanation after answering
Complementary base-pairing rules specify the corresponding bases on a new strand; normal replication pairs one original strand with one newly made strand.
Explain your reasoning without notes. If a key idea is missing, revisit the lesson and try again.
Protein Synthesis
Learning goals
- I can describe transcription (DNA to mRNA) and translation (mRNA to protein).
- I can explain how the genetic code is read in codons and how mutations can change a protein.
Readings for this unit
Before this unit
Distinguish DNA, RNA and amino acids.
Use three flexible study sessions: core explanation and Parts 1–2; Parts 3–4 with their reasoning checks and models; then the whole-unit application, worked examples, independent practice, and exit check. Allow about 50–60 minutes per session, including diagrams, data work, and notebook explanations. Attempt each check before opening its guidance. Schedule chapter investigations, review, and exams separately; add time where prerequisites are uncertain. Trace the explained visual parts and write a first model, then attempt the illustrated and changed independent cases. In the third session explain a correction and revise the opening account using evidence.
Start with something to explain
Why can one DNA change alter a protein while another does not?
Illustrative evidence case. The supplied code is redundant and gene-to-trait effects include several intermediate stages.
Notice and wonder
Record two observations using the stated quantities or relationships. Keep observations separate from possible causes. Write one question that a new measurement could help answer.
Why can one DNA change alter a protein while another does not?
Your first model
Label template, mRNA direction, codon grouping, amino acids and a functional test.
Build the language from the idea
- transcription
- The process of copying a gene's DNA into a strand of messenger RNA (mRNA).
- mRNA (messenger RNA)
- A single-stranded working copy of a gene that carries its instructions out of the nucleus to a ribosome.
- codon
- A group of three mRNA bases that codes for one specific amino acid (or a start/stop signal).
- translation
- The process of reading mRNA codons at a ribosome to build a chain of amino acids.
- ribosome
- The cell structure that reads mRNA and links amino acids together to build a protein.
- amino acid
- One of the 20 building blocks that link together in a specific order to form a protein.
- stop codon
- An mRNA codon such as UAA that signals termination instead of adding another amino acid.
DNA holds the master instructions for life — but instructions are useless until something acts on them. That something is proteins: the molecules that build your tissues, carry oxygen, digest food, fight infection, and speed up nearly every chemical reaction in your body. Genetics summarizes one important information pathway for protein-coding genes with a tidy pathway sometimes called the central dogma: DNA to RNA to protein. In this pathway, information in a protein-coding gene is first copied into a portable messenger, and that messenger is then read to assemble a protein.
The first step, transcription, happens inside the nucleus. A section of DNA — one gene — unzips, and one strand serves as a template while the cell builds a matching strand of mRNA (messenger RNA). The pairing rules are almost the same as in DNA, with one twist: RNA uses the base uracil (U) wherever DNA would use thymine, so a DNA template written 3′-A-T-G-5′ is copied into mRNA written 5′-U-A-C-3′. This mRNA is a disposable working copy of the gene, and unlike the precious original DNA, it can safely leave the nucleus and travel out to where proteins are made.
Out in the cytoplasm, the mRNA docks with a ribosome, the molecular machine that carries out translation. The ribosome reads the mRNA three bases at a time, and each three-base 'word' is called a codon. Most sense codons specify an amino acid — one link in the chain — while stop codons signal termination rather than adding an amino acid, and as the ribosome moves down the message, it links the amino acids together in exactly the order the codons dictate. One special codon, AUG, acts as the 'start' signal, and three others act as 'stop' signals that tell the ribosome the protein is finished.
The rulebook that matches each codon to its amino acid is the genetic code, and two features of it are worth remembering. First, it is nearly universal — a bacterium, a banana, and a person all read the same codons the same way, which is powerful evidence that all life shares a common ancestor, and also why a human gene can be placed into bacteria to mass-produce a medicine like insulin. Second, it is redundant: there are 64 possible codons but only 20 amino acids, so several different codons can call for the same amino acid.
This whole pathway is also where mutations make their mark. Because a protein's shape and job depend on its exact sequence of amino acids, a change in the DNA can ripple downstream into the protein. Some changes are silent — thanks to the code's redundancy, an altered codon may still specify the same amino acid, leaving the protein unchanged. Others swap one amino acid for another, and a single such swap is what causes sickle-cell disease. The most disruptive change of all can turn an ordinary codon into a 'stop,' cutting the protein short before it is complete. That range — from no effect at all to dramatic — is exactly why mutations can be neutral, harmful, or occasionally helpful.
Transcription uses DNA information to produce RNA, while translation uses messenger RNA information to build a polypeptide. Some genes produce functional RNAs that are not translated. The common DNA→RNA→protein model describes an important pathway without covering every biological case.
A codon is a sequence of three mRNA bases specifying an amino acid or a translation signal. Multiple codons can specify the same amino acid. Read the supplied code table for mRNA, and keep template DNA, coding DNA and mRNA conventions distinct.
A protein's final function depends on folding, processing and cellular context as well as amino-acid sequence. A sequence change can have no detectable effect, disrupt function or alter it under particular conditions. Do not assume every mutation produces a visible trait change.
Build your understanding
Use three flexible study sessions: core explanation and Parts 1–2; Parts 3–4 with their reasoning checks and models; then the whole-unit application, worked examples, independent practice, and exit check. Allow about 50–60 minutes per session, including diagrams, data work, and notebook explanations. Attempt each check before opening its guidance. Schedule chapter investigations, review, and exams separately; add time where prerequisites are uncertain.
Part 1 · Two steps, two molecules, two places
Transcription makes RNA from a DNA template. Translation uses mRNA information at a ribosome to build a polypeptide. In a typical eukaryotic pathway, RNA processing and export connect a nuclear transcription step with cytoplasmic translation; prokaryotic organization differs. Some genes make functional RNAs that are not translated. DNA is not itself the food or building material incorporated as amino acids. Distinguish an information relationship from a physical transfer of every gene molecule out of the nucleus.
Read the visual model
Identify the labeled structures and units, then trace the arrows or compare values under the caption’s stated conditions. Separate the displayed evidence from a further inference. Write your reasoning before opening the guidance.
Does every transcribed RNA necessarily become a protein?
Visual reasoning — after your attempt
No. Functional noncoding RNAs have other roles; the mRNA-to-polypeptide route is an important selected pathway.
Protein synthesis runs in two stages. Transcription copies one gene's sequence from DNA into messenger RNA, by the same complementary pairing used in replication except that uracil takes thymine's place opposite adenine. In a eukaryotic cell this happens in the nucleus, and the messenger RNA then leaves for the cytoplasm.
Translation reads that message at a ribosome. The RNA is read three bases at a time, and each triplet — a codon — specifies one amino acid or signals a stop. Transfer RNA molecules carry amino acids and have a three-base anticodon that pairs with the codon, so the order of codons determines the order of amino acids. The chain then folds, and its folded shape determines function.
Pause and explain
Why does the cell make an RNA copy rather than using the DNA directly at the ribosome?
Check your reasoning after answering
The DNA stays in the nucleus, where it is protected and kept intact as the permanent record, while a working copy travels to the ribosomes in the cytoplasm. Using a disposable copy also lets the cell control how many proteins are made from one gene.
Part 2 · Reading the code
A codon is a three-base mRNA unit specifying an amino acid or a translation signal under the genetic code. RNA uses U where DNA uses T. The supplied 3′→5′ template produces 5′-AUG GCA UAA-3′; reading the provided entries yields methionine then alanine and termination. A stop codon does not name another amino acid. Coding DNA resembles the mRNA sequence with T replacing U, whereas template DNA is complementary. Keep sequence direction and strand identity explicit before decoding.
Read the visual model
Identify the labeled structures and units, then trace the arrows or compare values under the caption’s stated conditions. Separate the displayed evidence from a further inference. Write your reasoning before opening the guidance.
How many amino acids are specified before termination in this supplied example?
Visual reasoning — after your attempt
Two: methionine and alanine. UAA is a stop signal rather than a third amino acid.
Working an example makes the mechanism concrete. Take a DNA template reading TAC AAA CCG GGA ATT. Transcription pairs each base and substitutes uracil for thymine, giving the messenger RNA AUG UUU GGC CCU UAA. Translating those codons yields methionine, phenylalanine, glycine, proline, and then a stop, so the polypeptide is four amino acids long.
Two features of the code show up immediately. AUG both specifies methionine and marks where translation starts, and UAA specifies no amino acid at all but ends the chain. The code is also redundant: GGC and GGU both specify glycine, so some base changes alter the message without altering the protein.
Pause and explain
The mRNA AUG UUU GGC CCU UAA has five codons. Why is the polypeptide only four amino acids long?
Check your reasoning after answering
UAA is a stop codon; it ends translation and specifies no amino acid. Only the first four codons add amino acids to the chain.
Part 3 · Mutation types and their different scales
A substitution changes a base; an insertion or deletion changes sequence length. A reading frame groups consecutive bases into codons, so a non-three-base insertion within a translated region can alter downstream grouping. Code redundancy allows a substitution to retain the same amino acid, as GCA and GCU both specify alanine in the supplied entries. Other changes alter an amino acid or termination. Effects depend on location, regulation and protein context; not every mutation is visible or every substitution harmless.
Read the visual model
Identify the labeled structures and units, then trace the arrows or compare values under the caption’s stated conditions. Separate the displayed evidence from a further inference. Write your reasoning before opening the guidance.
Why does GCA→GCU not change this amino acid, while GCA→GUA does?
Visual reasoning — after your attempt
The supplied code maps GCA/GCU to alanine and GUA to valine; different codons can share or differ in meaning.
A substitution replaces one base. Because of redundancy it may be silent, leaving the amino acid unchanged; it may be a missense change, substituting a different amino acid; or it may create a premature stop, truncating the protein. The consequence depends on which codon changed and whether the affected region is critical to folding or to a binding site.
Insertions and deletions behave differently. Adding or removing a base that is not a multiple of three shifts the reading frame, so every codon downstream is read in the wrong grouping. Almost all subsequent amino acids are then wrong and a premature stop usually appears. This is why frameshift mutations are generally far more damaging than substitutions, and why the distinction is worth more than the vocabulary suggests.
Pause and explain
Why does deleting three consecutive bases usually do less damage than deleting one?
Check your reasoning after answering
Removing three bases removes exactly one codon and leaves the reading frame intact, so the rest of the protein is unchanged apart from one missing amino acid. Removing one base shifts the frame, so every codon after it is misread.
Part 4 · From a base change to a characteristic
A phenotype is an observed characteristic under specified conditions. A sequence can influence RNA, protein production, folding, localization and interactions before affecting a trait. Processing can modify a polypeptide after translation. A visible difference does not by itself identify a unique gene, and a DNA change does not by itself prove a functional change. Test intermediate predictions and consider environment, other genes and regulation. A complete explanation connects the measured stages while admitting where evidence is absent.
Read the visual model
Identify the labeled structures and units, then trace the arrows or compare values under the caption’s stated conditions. Separate the displayed evidence from a further inference. Write your reasoning before opening the guidance.
Would detecting a DNA variant alone demonstrate altered enzyme activity?
Visual reasoning — after your attempt
No. Expression, protein properties and functional measurements are needed to test the proposed chain.
The chain from genotype to phenotype has several conditional links, and naming them all is what distinguishes an explanation from a slogan. A changed base changes a codon; a changed codon may change an amino acid; a different amino acid may change the folded shape; a changed shape may change function; and a changed protein function may change a measurable characteristic.
Each "may" is doing real work. Redundancy can absorb the first step, a substitution in a non-critical region can leave folding intact, and an organism with two copies of a gene may be unaffected by a change in one. This is why most base changes have no visible effect, and why claims that a single gene straightforwardly determines a trait usually overstate the evidence.
Pause and explain
Give two distinct reasons a single base change might produce no observable effect.
Check your reasoning after answering
The code is redundant, so the new codon may specify the same amino acid and leave the protein identical. Alternatively, a different amino acid in a region that is not critical to folding or to the active site may leave function unchanged; a second working copy of the gene can also mask the effect.
Apply the whole unit · Transcribe, translate, then mutate
Illustrative sequences. The DNA template strand of a short gene reads TAC AAA CCG GGA ATT. Use these codon assignments: AUG methionine (start), UUU phenylalanine, GGC glycine, GGU glycine, CCU proline, UAA stop.
Your task
Transcribe the template into messenger RNA and translate it into a polypeptide, then work out the consequence of two separate changes: the template's third triplet CCG becoming CCA, and the deletion of the first A in the template's second triplet AAA. Classify each mutation and explain why their consequences differ in scale.
What your response should show
- Choose the appropriate biological model or relationship and state the conditions it assumes.
- Show the counts, rates, ratios, or intermediate reasoning the question requires.
- Use the supplied evidence to justify the conclusion and separate observation from inference.
- Identify a meaningful limitation, uncertainty, or next measurement.
Response guidance — after your attempt
Transcribe by complementary pairing with uracil for adenine: TAC AAA CCG GGA ATT gives AUG UUU GGC CCU UAA.
Translate: methionine, phenylalanine, glycine, proline, then stop — a four-amino-acid polypeptide.
First change, CCG to CCA: the codon becomes GGU instead of GGC, and both specify glycine, so the polypeptide is unchanged. This is a silent substitution.
Second change, deleting one A from AAA: the template reads TAC AAC CGG GAA TT, so the mRNA becomes AUG UUG GCC CUU AA — every codon after the first is regrouped.
Assess the second change: the amino acids after methionine all differ from the original and the stop codon is lost from its position, so the protein is altered along its whole length. This is a frameshift.
Explain the difference in scale: a substitution affects at most one codon, while a deletion that is not a multiple of three changes the reading frame for everything downstream.
The template TAC AAA CCG GGA ATT transcribes to AUG UUU GGC CCU UAA and translates to methionine-phenylalanine-glycine-proline followed by a stop, a four-amino-acid chain. Changing CCG to CCA in the template gives the codon GGU in place of GGC; because the code is redundant and both specify glycine, the protein is identical and the mutation is silent. Deleting a single A from the second triplet shifts the reading frame: the mRNA becomes AUG UUG GCC CUU AA, so every codon after the start is regrouped, the amino acids downstream all differ, and the original stop codon is no longer in frame. The two changes differ in scale because a substitution can affect at most one codon while a frameshift misreads the entire remainder of the sequence — which is why insertions and deletions of one or two bases are generally far more damaging than single substitutions, and why deletions of exactly three bases sit between the two cases.
Scientific references and adapted source figures
Parent / teacher teaching notes
Work the transcription and translation by hand at least twice; the frameshift result is far more convincing when your child regroups the bases themselves and sees every downstream codon change. Redundancy is the idea that prevents the common overstatement that any DNA change alters the organism, so ask for the silent case explicitly. The full genotype-to-phenotype chain, with its conditional steps, is the paragraph to be able to produce on demand, since the genetics units ahead depend on it. Ask for an explanation of each label, arrow and axis before calculation. Keep first and revised models; attempt the changed case before consulting guidance. Distinguish invented instructional records from named historical sources. Source chromosome symbols are allele-category models, not DNA sequences. These independently authored high-school supplements are not the full OpenSciEd teacher editions or an endorsement.
The key idea
A protein-coding gene is transcribed into RNA and its processed mRNA can be translated into a polypeptide. Some genes make functional RNA instead. Strand direction, reading frame, start/stop signals and subsequent processing matter when predicting a protein.
Codon Length
number of mRNA bases = 3 x (number of amino acids)
each amino acid is coded by one 3-base codon (a complete gene also needs a start and a stop codon).
Worked examples
Example 1
- Transcribe by pairing each DNA base with its RNA partner, using uracil (U) in place of thymine: T to A, A to U, C to G, A to U, A to U, A to U.
- Reading in order, the mRNA is A-U-G-U-U-U.
- Split it into codons of three: AUG and UUU. The first codon is AUG.
Example 2 · Worked application
- RNA pairing with the template gives AUG, using U instead of T.
- Transcription makes RNA; translation reads mRNA codons to assemble amino acids.
- AUG commonly specifies methionine and can function as a start codon in the proper context.
Specify template versus coding strand before converting a sequence.
Example 3
- Compare the codons: only the third base changed, from G to A — a single-base substitution.
- UGG normally adds tryptophan and lets translation continue; UGA is a stop signal.
- The ribosome will stop building the protein at this point instead of continuing.
Example 4
- Read the mRNA codons as supplied, not their complements.
- Match AUG to methionine and GCU to alanine.
Example 5 · Find and fix the mistake
- Test the claim against the stated conditions: Specify template versus coding strand before converting a sequence.
- Transcription and translation connect DNA information to protein, with processing and regulation depending on the organism.
Specify template versus coding strand before converting a sequence.
Example 6 · Reason from the visual evidence
- A substitution changes a base; an insertion or deletion changes sequence length. A reading frame groups consecutive bases into codons, so a non-three-base insertion within a translated region can alter downstream grouping. Code redundancy allows a substitution to retain the same amino acid, as GCA and GCU both specify alanine in the supplied entries. Other changes alter an amino acid or termination. Effects depend on location, regulation and protein context; not every mutation is visible or every substitution harmless.
- The supplied code maps GCA/GCU to alanine and GUA to valine; different codons can share or differ in meaning.
Original supplied-code sequence comparisons, not pathogenic-variant identification or the full range of molecular effects.
Avoid these mistakes
- A codon table typically reads mRNA codons, not a DNA template directly.
Check your understanding
An mRNA contains AUG followed by GCU. Using a supplied table showing AUG=Met and GCU=Ala, identify the first two amino acids.
Discuss the answer
Methionine followed by alanine in this simplified translation example.
Why may a DNA sequence change fail to change a protein's amino-acid sequence?
Discuss the answer
Redundant codons can specify the same amino acid, and some changes are outside the translated region. Processing and regulation add other possibilities; use the sequence context and a supplied code.
Return to the phenomenon
Return to the initial case. Why can one DNA change alter a protein while another does not? Revise your drawing or explanation using two named ideas and one stated limitation.
Compare explanations after your attempt
Sequence changes can preserve or alter translation; a phenotype claim requires evidence through relevant regulation and protein function.
What should we investigate next?
Which comparison would test a remaining uncertainty? State what you would change, keep comparable and measure.
Investigate, explain and revise
Complete these tasks after the teaching parts. Preserve your first model and a supported revision; use guidance after a real attempt.
Activity 1 · Return to the opening case
Use the opening question, defined terms, Parts 1–4 and your notebook. The supplied-data route needs no equipment or external account.
Your task
Return to the initial case. Why can one DNA change alter a protein while another does not? Revise your drawing or explanation using two named ideas and one stated limitation.
Success criteria
- Use relevant stated observations.
- Explain the mechanism with a labeled model.
- Distinguish quantities and assumptions.
- Describe a revision and a useful next test.
Hint
Follow objects, materials and information separately. Check what each measured quantity means.
Response guidance — discuss after your attempt
Sequence changes can preserve or alter translation; a phenotype claim requires evidence through relevant regulation and protein function.
Activity 2 · Transfer to a changed case
Cover the worked guidance and use the unit explanations/figures to solve a changed problem.
Your task
Using GCA=Ala, GCU=Ala and GUA=Val, compare a coding-region change that gives GCU versus one giving GUA in mRNA. Explain why neither sequence result alone determines a whole-organism trait.
Success criteria
- Use the stated measurements or conditions, with correct units.
- Connect the result to the biological mechanism or evidence relationship.
- Identify the assumption, model limit or further evidence requested.
Hint
Name the stated conditions, select the relevant mechanism and show intermediate reasoning.
Response guidance — discuss after your attempt
GCU retains alanine; GUA specifies valine. Regulatory context, protein folding/activity and other biological conditions determine downstream effects, so a measured trait needs additional evidence.
Words to know
- transcription
- The process of copying a gene's DNA into a strand of messenger RNA (mRNA).
- mRNA (messenger RNA)
- A single-stranded working copy of a gene that carries its instructions out of the nucleus to a ribosome.
- codon
- A group of three mRNA bases that codes for one specific amino acid (or a start/stop signal).
- translation
- The process of reading mRNA codons at a ribosome to build a chain of amino acids.
- ribosome
- The cell structure that reads mRNA and links amino acids together to build a protein.
- amino acid
- One of the 20 building blocks that link together in a specific order to form a protein.
- stop codon
- An mRNA codon such as UAA that signals termination instead of adding another amino acid.
How the code was cracked
In the early 1960s, Marshall Nirenberg and colleagues broke the genetic code with a clever trick: they built an artificial mRNA made entirely of uracil (UUU-UUU...) and found it produced a protein of pure phenylalanine. So UUU means phenylalanine. One synthetic RNA at a time, researchers mapped all 64 codons. The result is a compact dictionary: 64 codons, one start signal (AUG), three stop signals, and just 20 amino acids.
One gene, several proteins
In your cells, a freshly transcribed mRNA is edited before use: non-coding stretches called introns are snipped out and the coding pieces (exons) are joined together. Because the cell can join those pieces in different combinations — alternative splicing — a single gene can direct the building of several different proteins. It's one reason humans manage such complexity with only about 20,000 protein-coding genes, far fewer than scientists once expected.
Why some antibiotics target ribosomes
Bacterial ribosomes are built slightly differently from the ribosomes in your own cells. Several antibiotics, including tetracycline and erythromycin, exploit that difference by jamming the bacterial ribosome so it can't finish translation — halting the bacteria's protein production while leaving your cells largely untouched. Understanding translation isn't just theory; it's the basis of drugs that have saved countless lives.
The code is (almost) universal
A remarkable fact is that nearly every organism on Earth — bacteria, oak trees, jellyfish, humans — reads the same codons to mean the same amino acids. This near-universality is strong evidence that all life descends from a common ancestor. It also has a powerful practical payoff: scientists can insert the human gene for insulin into bacteria, and because the bacteria read the code the same way, they faithfully build human insulin, which is now manufactured this way for people with diabetes.
Breaking the one-way street
The central dogma usually flows one way: DNA to RNA to protein. But some viruses run it backward. Retroviruses such as HIV carry their genes as RNA and use an enzyme called reverse transcriptase to copy that RNA back into DNA, which then sneaks into the host's genome. Discovering this exception reshaped biology — and reverse transcriptase became an everyday laboratory tool for studying genes.
In the real world
mRNA vaccines, including several COVID-19 vaccines, work by delivering a piece of mRNA into your cells so that your own ribosomes translate it into a harmless viral protein — training your immune system without ever using the live virus.
Exit check
Trace information from a protein-coding gene to a protein.
Check your explanation after answering
Transcription produces RNA from a DNA template. After appropriate processing in a eukaryote, translation at a ribosome reads codons to assemble an amino-acid sequence.
Explain your reasoning without notes. If a key idea is missing, revisit the lesson and try again.
Mendelian Genetics
Learning goals
- I can use a Punnett square to predict the genotype and phenotype ratios of a monohybrid cross.
- I can express genetic outcomes as probabilities and combine them using the multiplication rule.
Readings for this unit
Before this unit
Use a probability grid and distinguish dominant from common.
Use three flexible study sessions: core explanation and Parts 1–2; Parts 3–4 with their reasoning checks and models; then the whole-unit application, worked examples, independent practice, and exit check. Allow about 50–60 minutes per session, including diagrams, data work, and notebook explanations. Attempt each check before opening its guidance. Schedule chapter investigations, review, and exams separately; add time where prerequisites are uncertain. Trace the explained visual parts and write a first model, then attempt the illustrated and changed independent cases. In the third session explain a correction and revise the opening account using evidence.
Start with something to explain
Why does a Punnett-square ratio fail to predict every small family exactly?
Illustrative evidence case. Gamete combinations define probabilities; finite samples fluctuate and dominant does not mean common.
Notice and wonder
Record two observations using the stated quantities or relationships. Keep observations separate from possible causes. Write one question that a new measurement could help answer.
Why does a Punnett-square ratio fail to predict every small family exactly?
Your first model
Draw gamete contributions and separate expected proportion from observed count.
Build the language from the idea
- allele
- A variant at a genetic locus.
- dominant
- Expressed in the heterozygote under a specified complete-dominance model; not necessarily common or beneficial.
- recessive
- Not expressed in the heterozygote’s modeled phenotype under complete dominance.
- homozygous
- Having the same allele at both copies of a diploid locus.
- heterozygous
- Having different alleles at a diploid locus.
- genotype
- The genetic variants specified for a locus or organism.
- phenotype
- A measured or observed characteristic influenced by genotype and context.
- Punnett square
- A probability model of gamete combinations under stated assumptions.
Mendelian models follow alleles through gametes and fertilization. At a stated diploid locus, homozygotes have matching alleles and heterozygotes have different alleles. Under complete dominance, the heterozygote has the modeled dominant phenotype. Dominance does not mean greater frequency or a better trait.
For Aa × Aa, independent equally likely gametes give expected genotypes AA, Aa, Aa, aa. Genotype probabilities are 1/4, 1/2, 1/4; under complete dominance the phenotype expectation is 3/4 dominant and 1/4 recessive. These are probabilities, not guaranteed counts in each small group.
Use known genotypes and a specified model. A test cross with aa can reveal a hidden recessive allele if an aa descendant appears under the model. All dominant descendants in a small sample do not prove the tested parent is AA. Human eye color and many other traits involve several genes; they should not be presented as literal one-gene examples.
A one-gene model can illustrate allele segregation when assumptions are explicit. Dominance describes how alleles relate to a phenotype in a heterozygote; it does not mean an allele is stronger, more common or beneficial. Use hypothetical traits rather than forcing complex human traits into this model.
A Punnett square describes probabilities for each offspring, not a required family composition. Four offspring do not have to include every predicted category once. Independent events can produce uneven small-sample counts.
Genotype and phenotype differ, and environment can affect expression. The model also assumes specified parental genotypes and a simple allele relationship. If those conditions are not met, more evidence is needed before calculating a trait probability.
Build your understanding
Use three flexible study sessions: core explanation and Parts 1–2; Parts 3–4 with their reasoning checks and models; then the whole-unit application, worked examples, independent practice, and exit check. Allow about 50–60 minutes per session, including diagrams, data work, and notebook explanations. Attempt each check before opening its guidance. Schedule chapter investigations, review, and exams separately; add time where prerequisites are uncertain.
Part 1 · Alleles, genotype, phenotype
An allele is a version at a genetic locus. Genotype records the relevant allele combination; phenotype is the measured characteristic under conditions. Complete dominance means the heterozygote matches one homozygous phenotype for the specified trait model. Dominant does not mean common, stronger, healthier or more fit in every environment. A one-locus two-allele model is useful for a constrained case, but complex traits can involve multiple genes and environmental effects. State the allele-to-phenotype relationship before reading the square.
Read the visual model
Identify the labeled structures and units, then trace the arrows or compare values under the caption’s stated conditions. Separate the displayed evidence from a further inference. Write your reasoning before opening the guidance.
Does a 3:1 phenotype prediction mean a dominant allele must be present in 75% of every population?
Visual reasoning — after your attempt
No. It is a probability prediction for this specified cross, not a population-frequency rule.
A gene occupies a position on a chromosome, and because chromosomes come in homologous pairs, a diploid organism carries two copies of each gene. Different versions of a gene are alleles. An organism with two identical alleles is homozygous; with two different alleles, heterozygous. The pair of alleles is the genotype; the observable characteristic is the phenotype.
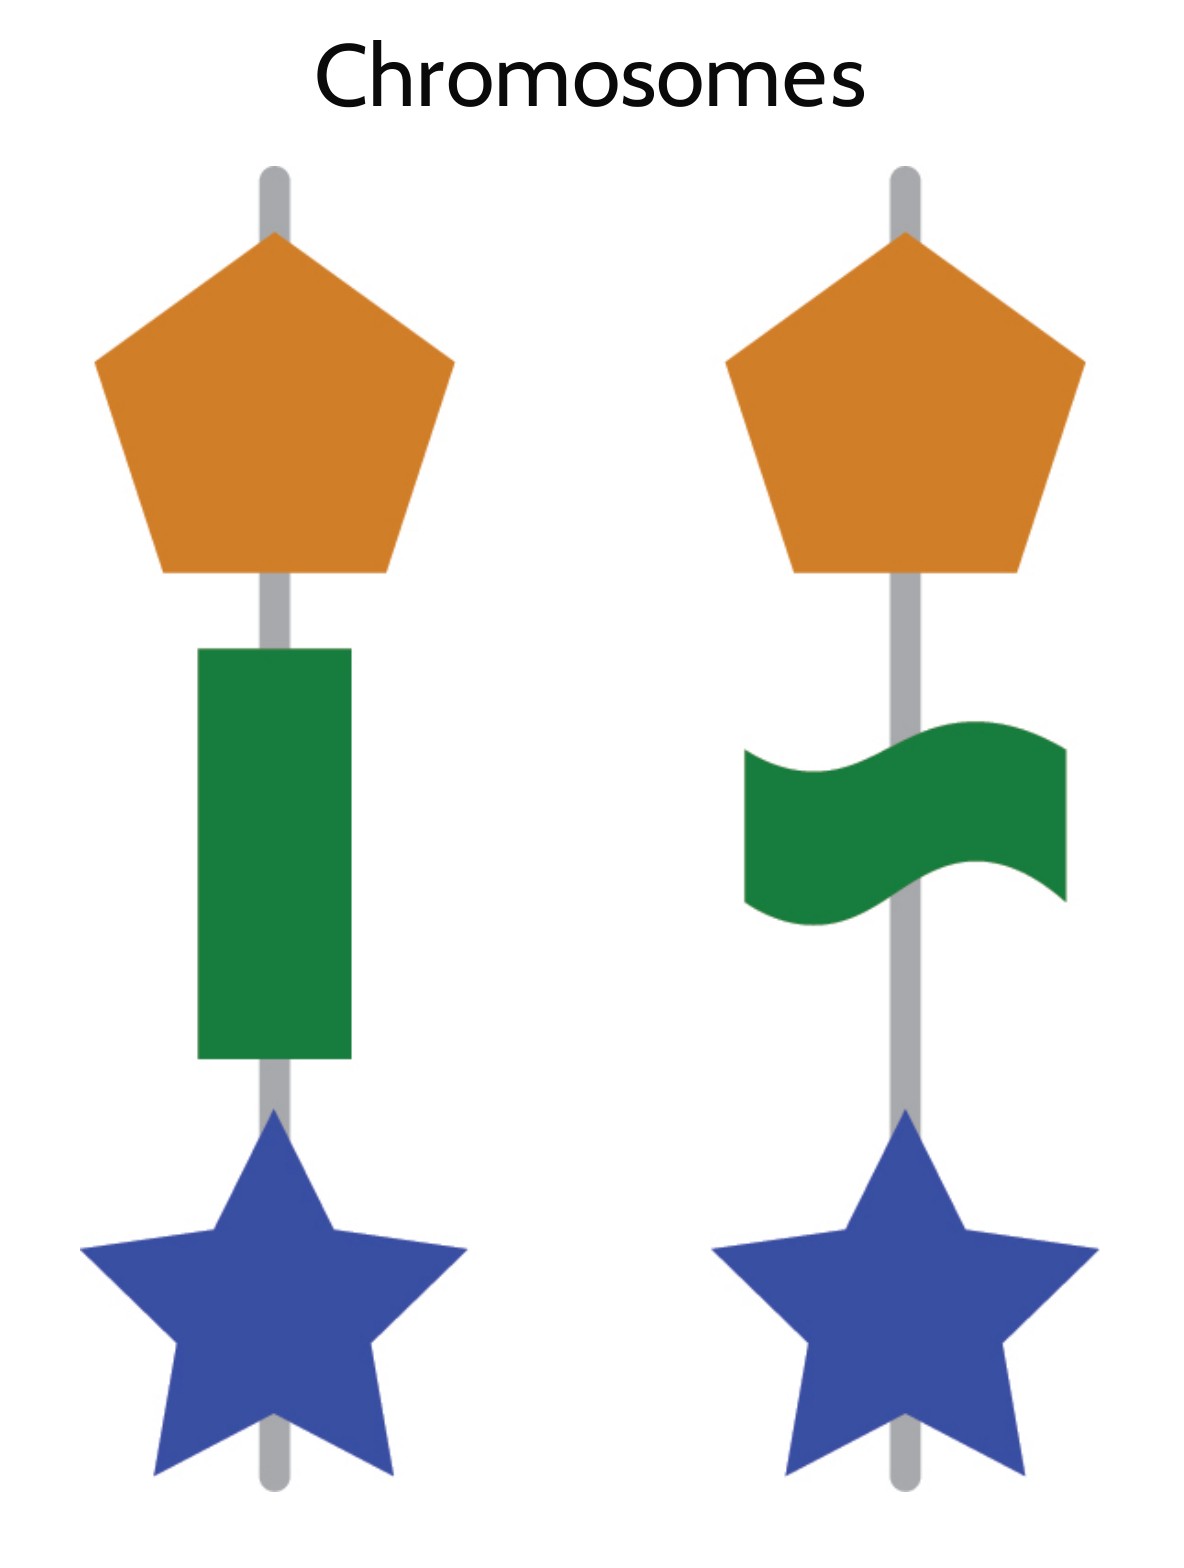
The relation between the two is the whole subject. When one allele is fully dominant, a heterozygote shows the same phenotype as a dominant homozygote, so two different genotypes produce one phenotype. That is why a phenotype does not reveal a genotype, and why inferring genotypes requires reasoning from crosses rather than from appearance.
Pause and explain
Why can you not read an individual's genotype from its dominant phenotype?
Check your reasoning after answering
Both a dominant homozygote and a heterozygote show the dominant phenotype, so the appearance is consistent with two different genotypes. Distinguishing them requires evidence from offspring, such as a test cross.
Part 2 · Why the ratios come out as they do
Segregation describes separation of allele copies with homologous chromosomes in the simple diploid model. A heterozygous parent supplies A or a gametes with equal probability under the stated assumptions; an aa parent supplies a. A Punnett square combines these contributions to predict genotype probabilities. The repeated column labels do not mean the second parent has more a alleles per gamete. Linkage, unequal gamete viability and other factors can change outcomes in more complex models.
Read the visual model
Identify the labeled structures and units, then trace the arrows or compare values under the caption’s stated conditions. Separate the displayed evidence from a further inference. Write your reasoning before opening the guidance.
Why do repeated a columns not mean an individual gamete contributes two a alleles?
Visual reasoning — after your attempt
Each cell combines one contribution from each parent; repeated columns display equivalent equally weighted possibilities.
Meiosis supplies the mechanism. A heterozygote's two alleles separate into different gametes, so half its gametes carry each allele. Combining gametes from two heterozygotes gives four equally likely pairings, which produce one dominant homozygote, two heterozygotes, and one recessive homozygote — a 1:2:1 genotype ratio and, with full dominance, a 3:1 phenotype ratio.
A Punnett square is simply a way of listing those pairings systematically. It is a probability table, not a prediction about a particular offspring, and its value lies in making the gamete combinations explicit. Drawing one correctly requires identifying each parent's gametes first, which is where most errors occur.
Pause and explain
Which event in meiosis accounts for a heterozygote producing two kinds of gamete in equal proportions?
Check your reasoning after answering
The separation of homologous chromosomes in meiosis I. The two alleles sit on homologous chromosomes, which separate into different cells, so half the gametes carry each allele.
Part 3 · Probability, not prophecy
A probability describes a model of possible outcomes, not a promised number in every small sample. For a recessive-category probability of 1/4 and 80 independent modeled offspring, the expected count is 20. Actual samples vary through chance, and unexpected counts require evaluation of sample size, model conditions and measurement rather than immediate rejection or certainty. Independent births in the model do not acquire a memory that forces the next child to balance earlier outcomes.
Read the visual model
Identify the labeled structures and units, then trace the arrows or compare values under the caption’s stated conditions. Separate the displayed evidence from a further inference. Write your reasoning before opening the guidance.
After three dominant-category outcomes, is a recessive-category fourth outcome guaranteed?
Visual reasoning — after your attempt
No. Each modeled independent outcome retains its probability; earlier outcomes do not force a balancing result.
A 3:1 expectation describes long-run proportions, and small samples depart from it routinely. Each conception is also independent: three recessive offspring in a row do not make a dominant offspring more likely next time, because which gametes meet is unaffected by previous events. The gambler's fallacy is the most common error in this unit and it is worth naming directly.
This also shapes how observed counts are judged. A Tt × Tt cross producing 140 dominant and 60 recessive out of 200 differs from the expected 150 and 50, but a deviation of that size arises from chance often enough that the data do not contradict the model. Deciding properly means asking how often chance alone would produce a deviation at least that large, rather than comparing the numbers by eye.
Pause and explain
A family of four children from a Tt × Tt cross shows no recessive phenotypes. Does this contradict the 3:1 expectation?
Check your reasoning after answering
No. The probability that all four show the dominant phenotype is (3/4)⁴, about 32 percent, so this outcome is common. Ratios describe expectations over large numbers, and a sample of four cannot test them.
Part 4 · Reasoning backwards from offspring
A test cross compares offspring under a specified mating and phenotype model to distinguish possible parental genotypes. If an A-category parent could be AA or Aa, crossing with aa predicts different outcomes. Observed aa supports the presence of a in the A-category parent under the model. Seeing no aa in a small sample does not prove AA, because an Aa parent could by chance yield only Aa. State parentage, penetrance, environment and sample assumptions before making a stronger inference.
Read the visual model
Identify the labeled structures and units, then trace the arrows or compare values under the caption’s stated conditions. Separate the displayed evidence from a further inference. Write your reasoning before opening the guidance.
Could an Aa×aa cross produce four Aa offspring by chance?
Visual reasoning — after your attempt
Yes. Under independent equal-probability outcomes the probability is (1/2)⁴=1/16, so absence of aa in four is not proof of AA.
The useful skill is inference: deducing genotypes from the phenotypes of parents and offspring. The strongest evidence comes from a recessive offspring, because it must have received a recessive allele from each parent. Two parents who both show the dominant phenotype and have a recessive child must therefore both be heterozygous.
A test cross formalizes the method. Crossing an individual of unknown genotype with a homozygous recessive produces recessive offspring only if the unknown parent carried a recessive allele, so a single recessive offspring settles the question. The absence of recessive offspring is weaker evidence, because a heterozygote can by chance produce none in a small number of offspring.
Pause and explain
A test cross produces 12 offspring, all showing the dominant phenotype. Is the tested parent homozygous dominant?
Check your reasoning after answering
Probably, but not certainly. A heterozygote would be expected to give about half recessive offspring, and the chance of 12 non-recessive offspring from a heterozygote is (1/2)¹², about one in 4,000 — unlikely but not impossible, so the conclusion is strong rather than proven.
Apply the whole unit · Infer genotypes from a breeding record
Illustrative breeding records for coat colour in a mammal, where dark coat is fully dominant over light. Cross 1: dark × light → 31 dark, 29 light. Cross 2: dark × dark → 44 dark, 16 light. Cross 3: light × light → 0 dark, 38 light.
Your task
Determine the genotypes of both parents in each cross and give the evidence for each determination, compare the observed counts with the expected ratios, and state which cross provides the strongest evidence about its parents' genotypes. Then explain what Cross 3 would have implied if even one dark offspring had appeared.
What your response should show
- Choose the appropriate biological model or relationship and state the conditions it assumes.
- Show the counts, rates, ratios, or intermediate reasoning the question requires.
- Use the supplied evidence to justify the conclusion and separate observation from inference.
- Identify a meaningful limitation, uncertainty, or next measurement.
Response guidance — after your attempt
Cross 1: roughly half the offspring are light, which is the expectation for a heterozygous dark parent crossed with a light homozygote, so the parents are Dd × dd; the observed 31:29 is close to the expected 30:30.
Cross 2: light offspring appear from two dark parents, so each dark parent must carry a recessive allele and both are Dd; the expected 3:1 ratio for 60 offspring is 45 dark and 15 light, against the observed 44 and 16.
Cross 3: both parents show the recessive phenotype, so both must be dd, and all offspring are necessarily dd — consistent with the 38 light and 0 dark observed.
Judge the evidence: Cross 2 is the most informative, because the appearance of any light offspring from two dark parents proves both parents heterozygous in a single observation.
Note Cross 1's role: it functions as a test cross, so its light offspring also establish the dark parent as heterozygous.
Consider the alternative for Cross 3: a single dark offspring from two light parents would contradict the assumption that dark is fully dominant over light, pointing instead to a mutation, a misidentified parent, or a more complex inheritance pattern than one gene with two alleles.
Cross 1 is Dd × dd: the roughly equal split of 31 dark to 29 light matches the 1:1 expectation and the light offspring establish that the dark parent carries a recessive allele. Cross 2 is Dd × Dd, proved by the appearance of light offspring from two dark parents, and the observed 44:16 is close to the expected 45:15. Cross 3 must be dd × dd, since both parents show the recessive phenotype, and all 38 offspring being light is the only possible outcome. Cross 2 gives the strongest evidence, because one light offspring from two dark parents settles both parents' genotypes at once, whereas an absence of recessive offspring would have left the question open. Had a single dark offspring appeared in Cross 3, the assumption of simple dominance would be in doubt: a new mutation, a misrecorded or mistaken parent, or an inheritance pattern involving more than one gene would each have to be considered, and the record alone could not distinguish them.
Scientific references and adapted source figures
- OpenSciEd 8.5 — genetics foundations and case models
- OpenSciEd middle-school source license — CC BY 4.0
Parent / teacher teaching notes
Require the gametes to be written out before any Punnett square is drawn; nearly every error in this unit comes from entering genotypes rather than gametes along the edges. The gambler's fallacy deserves to be raised explicitly, because it feels right to almost everyone. When comparing observed counts with expected ratios, resist both overconfident conclusions — a close match is not proof, and a modest deviation is not refutation — which is also the honest position the data support. Ask for an explanation of each label, arrow and axis before calculation. Keep first and revised models; attempt the changed case before consulting guidance. Distinguish invented instructional records from named historical sources. Source chromosome symbols are allele-category models, not DNA sequences. These independently authored high-school supplements are not the full OpenSciEd teacher editions or an endorsement.
An interactive Punnett square showing a cross between two parents, filling a 2x2 grid with the offspring allele combinations.
The key idea
Punnett squares predict probabilities under specified inheritance assumptions; samples can vary and many traits need more complex models.
Monohybrid Cross Ratio (Bb x Bb)
1 BB : 2 Bb : 1 bb → 3 dominant : 1 recessive
both parents are heterozygous (Bb) for a trait with simple dominant/recessive inheritance.
Multiplication Rule for Probability
P(A and B) = P(A) x P(B)
combining the probabilities of independent events, such as two separate offspring or two unlinked genes.
Worked examples
Example 1
- Set up the 2x2 square with P and p from each parent. The four boxes are PP, Pp, Pp, pp.
- Genotypes: one PP, two Pp, one pp — a 1:2:1 ratio.
- Phenotypes: PP, Pp, and Pp all show purple (P is dominant); only pp is white — a 3:1 ratio.
Example 2 · Worked application
- Aa produces A and a gametes equally; aa produces a.
- Offspring are half Aa and half aa.
- Aa shows the dominant phenotype under the model.
Probabilities describe many outcomes, not a guaranteed pattern in every small family.
Example 3
- From a Bb x Bb square (BB, Bb, Bb, bb), one of the four boxes is bb, so P(bb) = 1/4 for each child.
- Each birth is an independent event, so multiply the probabilities together.
- P(three bb in a row) = 1/4 x 1/4 x 1/4 = 1/64.
Example 4
- Each parent contributes A or a with probability one half.
- The four equally likely combinations are AA, Aa, aA and aa.
Example 5 · Find and fix the mistake
- Test the claim against the stated conditions: Probabilities describe many outcomes, not a guaranteed pattern in every small family.
- Each conception is a separate probability event under the model; small samples vary.
Probabilities describe many outcomes, not a guaranteed pattern in every small family.
Example 6 · Reason from the visual evidence
- A probability describes a model of possible outcomes, not a promised number in every small sample. For a recessive-category probability of 1/4 and 80 independent modeled offspring, the expected count is 20. Actual samples vary through chance, and unexpected counts require evaluation of sample size, model conditions and measurement rather than immediate rejection or certainty. Independent births in the model do not acquire a memory that forces the next child to balance earlier outcomes.
- No. Each modeled independent outcome retains its probability; earlier outcomes do not force a balancing result.
Original simulated family counts, not real breeding data or personal reproductive predictions.
Avoid these mistakes
- A 25% probability does not guarantee exactly one affected child in every four births.
Check your understanding
In a hypothetical complete-dominance model, cross Aa with Aa. Find genotype probabilities.
Discuss the answer
¼ AA, ½ Aa and ¼ aa; each offspring is a new probability event.
Why does dominant not mean common in a population?
Discuss the answer
Dominance describes a particular heterozygote phenotype mapping, not allele frequency, benefit or strength. Population abundance depends on history and several evolutionary processes.
Return to the phenomenon
Return to the initial case. Why does a Punnett-square ratio fail to predict every small family exactly? Revise your drawing or explanation using two named ideas and one stated limitation.
Compare explanations after your attempt
Allele segregation and the stated phenotype model support probabilities, while sampling and biological conditions limit certainty.
What should we investigate next?
Which comparison would test a remaining uncertainty? State what you would change, keep comparable and measure.
Investigate, explain and revise
Complete these tasks after the teaching parts. Preserve your first model and a supported revision; use guidance after a real attempt.
Activity 1 · Return to the opening case
Use the opening question, defined terms, Parts 1–4 and your notebook. The supplied-data route needs no equipment or external account.
Your task
Return to the initial case. Why does a Punnett-square ratio fail to predict every small family exactly? Revise your drawing or explanation using two named ideas and one stated limitation.
Success criteria
- Use relevant stated observations.
- Explain the mechanism with a labeled model.
- Distinguish quantities and assumptions.
- Describe a revision and a useful next test.
Hint
Follow objects, materials and information separately. Check what each measured quantity means.
Response guidance — discuss after your attempt
Allele segregation and the stated phenotype model support probabilities, while sampling and biological conditions limit certainty.
Activity 2 · Transfer to a changed case
Cover the worked guidance and use the unit explanations/figures to solve a changed problem.
Your task
Under complete dominance, Aa×aa produces independent offspring with equal genotype probabilities. Find the expected aa count among 60 and the probability that the first three are all Aa.
Success criteria
- Use the stated measurements or conditions, with correct units.
- Connect the result to the biological mechanism or evidence relationship.
- Identify the assumption, model limit or further evidence requested.
Hint
Name the stated conditions, select the relevant mechanism and show intermediate reasoning.
Response guidance — discuss after your attempt
Expected aa count is 60×1/2=30. The probability of three Aa outcomes is (1/2)³=1/8. Neither expectation forces a specific finite family outcome.
Words to know
- allele
- A variant at a genetic locus.
- dominant
- Expressed in the heterozygote under a specified complete-dominance model; not necessarily common or beneficial.
- recessive
- Not expressed in the heterozygote’s modeled phenotype under complete dominance.
- homozygous
- Having the same allele at both copies of a diploid locus.
- heterozygous
- Having different alleles at a diploid locus.
- genotype
- The genetic variants specified for a locus or organism.
- phenotype
- A measured or observed characteristic influenced by genotype and context.
- Punnett square
- A probability model of gamete combinations under stated assumptions.
The monk whose peas waited 35 years
In a monastery garden in the 1860s, Gregor Mendel cross-bred thousands of pea plants and tracked traits like seed color and plant height across generations. His careful counting revealed the predictable ratios that Punnett squares now model — yet almost no one noticed. His work was essentially ignored until around 1900, when several scientists independently rediscovered the same patterns and realized Mendel had solved the puzzle decades earlier.
Beyond simple dominance
Not every trait obeys clean dominant-and-recessive rules. In incomplete dominance, neither allele fully wins and the heterozygote is a blend — a red snapdragon crossed with a white one gives pink. In codominance, both alleles show fully and separately at once — a person with type AB blood displays both the A and the B markers, and some cattle have coats with distinct patches of both red and white hair.
Most traits use many genes
Textbook one-gene examples are the simplest case. Most human traits — height, skin color, and much of eye color — are polygenic, shaped by many genes acting together, which is why they vary along a smooth range instead of falling into a few neat categories. Some genes also have multiple alleles in the population: the ABO blood group is controlled by a single gene with three different alleles, not just two.
Traits that ride on the X chromosome
Genes located on the X chromosome, such as those for red-green colorblindness and hemophilia, show a distinctive inheritance pattern. Because males have only one X, a single recessive allele there is enough to show the trait, while females (with two X's) would need two copies. This is why these sex-linked conditions appear far more often in males and can seem to 'skip' generations, passing silently through carrier mothers.
Probability, not prophecy
A predicted 3:1 ratio is an average over many offspring, not a promise about any small family — much like flipping a coin four times won't reliably give exactly two heads. Only across large numbers do the ratios become dependable (the law of large numbers). This is the same math genetic counselors use with real families: two carriers of a recessive condition face a 1-in-4 risk per child, every pregnancy, regardless of how previous ones turned out.
In the real world
Genetic counselors use exactly this Punnett-square math to tell prospective parents their chance of passing on a recessive condition such as cystic fibrosis — when both parents are carriers, the risk is the familiar 1 in 4 per child.
Exit check
Does a 25% predicted recessive probability guarantee one recessive offspring in every four?
Check your explanation after answering
No. It is an expected probability under the model; independent outcomes fluctuate, especially in small samples.
Explain your reasoning without notes. If a key idea is missing, revisit the lesson and try again.
Inheritance Beyond One-Gene Models
Learning goals
- I can distinguish complete dominance, incomplete dominance, and codominance.
- I can explain why many traits require several genes and environmental factors.
Readings for this unit
Before this unit
Distinguish genotype, phenotype and a model assumption.
Use three flexible study sessions: core explanation and Parts 1–2; Parts 3–4 with their reasoning checks and models; then the whole-unit application, worked examples, independent practice, and exit check. Allow about 50–60 minutes per session, including diagrams, data work, and notebook explanations. Attempt each check before opening its guidance. Schedule chapter investigations, review, and exams separately; add time where prerequisites are uncertain. Trace the explained visual parts and write a first model, then attempt the illustrated and changed independent cases. In the third session explain a correction and revise the opening account using evidence.
Start with something to explain
Why can a heterozygote look intermediate without its alleles permanently blending?
Illustrative evidence case. The phenotype mapping can be incomplete or codominant, while genotype contributions remain distinct.
Notice and wonder
Record two observations using the stated quantities or relationships. Keep observations separate from possible causes. Write one question that a new measurement could help answer.
Why can a heterozygote look intermediate without its alleles permanently blending?
Your first model
Label allele copies, measured products/traits and environmental conditions separately.
Build the language from the idea
- incomplete dominance
- A heterozygous phenotype is intermediate in the stated model.
- codominance
- Both allelic products are detectably expressed in a heterozygote.
- polygenic trait
- A trait influenced by variation at multiple genes.
A one-gene, two-allele Punnett square describes a limited model. Under complete dominance, a heterozygote has the modeled dominant phenotype. In incomplete dominance it can have an intermediate phenotype; in codominance both allelic products can be expressed. Dominant does not mean common, stronger, or beneficial.
Some traits involve many genes, environmental effects, or both. Human eye color is influenced by several genes affecting pigment; it is not accurately represented by a single brown-versus-blue pair. Continuous measurements such as height often show distributions rather than a few discrete categories. A simple model can still be useful if its limits are explicit.
Inheritance probabilities describe expected patterns across many outcomes. Four Punnett-square boxes do not guarantee four offspring, one of each outcome. Small samples can differ from expected ratios. Use genotype data, sample sizes, and a specified inheritance model before drawing conclusions from appearances.
Traits can involve incomplete dominance, codominance, several alleles, many genes or gene interactions. Multiple alleles describe possibilities in a population; a diploid individual still normally carries two alleles at one autosomal locus. Name the specific model before predicting outcomes.
Polygenic traits can show a range of values and environmental effects. A broad distribution is not evidence that inheritance is absent. It means a one-gene dominant/recessive square may be inadequate for that trait.
Linkage changes expectations because genes on one chromosome need not assort independently. Sex-linked inheritance also depends on chromosome and parental information. State the provided conditions and avoid inferring real human family outcomes from an oversimplified trait example.
Build your understanding
Use three flexible study sessions: core explanation and Parts 1–2; Parts 3–4 with their reasoning checks and models; then the whole-unit application, worked examples, independent practice, and exit check. Allow about 50–60 minutes per session, including diagrams, data work, and notebook explanations. Attempt each check before opening its guidance. Schedule chapter investigations, review, and exams separately; add time where prerequisites are uncertain.
Part 1 · Dominance is not always complete
Incomplete dominance means a heterozygous phenotype differs from both homozygotes for the defined trait. Codominance means both specified allele-associated products are detected in the heterozygote. Neither description implies that alleles merge into a permanent new allele. A model can predict 1:2:1 phenotype categories rather than the complete-dominance 3:1 pattern. State what is measured—color, product presence or another feature—before comparing models, and avoid treating every intermediate phenotype as proof of one gene.
Read the visual model
Identify the labeled structures and units, then trace the arrows or compare values under the caption’s stated conditions. Separate the displayed evidence from a further inference. Write your reasoning before opening the guidance.
Does an intermediate Rr phenotype mean future gametes contain only a new blended allele?
Visual reasoning — after your attempt
No. The genotype retains R and r in the model, which segregate as distinct contributions.
Simple dominance is one pattern among several. In incomplete dominance, the heterozygote's phenotype lies between the two homozygotes — a red and a white parent giving pink offspring — because neither allele's product fully determines the outcome. In codominance, both alleles are expressed fully and separately, so the heterozygote shows both characteristics at once rather than a blend, as in certain coat patterns with distinct patches of each colour.
The distinction is observable rather than definitional. A blend points to incomplete dominance; both features appearing separately points to codominance. In both cases the heterozygote is identifiable by sight, which means the genotype can be read from the phenotype — the opposite of the situation under full dominance.
Pause and explain
Under incomplete dominance, why is a test cross unnecessary to identify a heterozygote?
Check your reasoning after answering
The heterozygote has its own distinct intermediate phenotype, so it can be recognized directly. A test cross is needed only when two genotypes share one phenotype, as they do under full dominance.
Part 2 · More than two alleles, and more than one gene
Multiple alleles means more than two allele versions exist at a locus in a population; a typical diploid individual still carries two copies there. Polygenic traits involve contributions from several loci, often interacting with conditions. A broad distribution can also involve environmental and measurement variation, so a bell-like shape is not a unique proof of a particular gene count. A one-gene square cannot fully represent a trait with many interacting inputs without additional modeling assumptions.
Read the visual model
Identify the labeled structures and units, then trace the arrows or compare values under the caption’s stated conditions. Separate the displayed evidence from a further inference. Write your reasoning before opening the guidance.
Does three known allele versions in a population mean every diploid individual has three copies at that locus?
Visual reasoning — after your attempt
No. Population variation and an individual’s copy number are different quantities.
A gene may have more than two alleles in a population, even though a diploid individual carries only two. Human ABO blood type is the standard case: three alleles, with A and B codominant to each other and both dominant to O, producing four phenotypes from six genotypes. A single individual's two alleles are drawn from the three available in the population.
Traits may also depend on several genes. When many genes each contribute a small effect, the result is continuous variation — height, skin colour, and many measures of size and yield behave this way. Instead of a few discrete classes, the population shows a graded distribution, usually with most individuals near the middle and fewer at the extremes.
Pause and explain
Why does ABO blood type have four phenotypes but six genotypes?
Check your reasoning after answering
Three alleles give six possible pairs. Because the O allele is recessive to both A and B, the pairs AA and AO both give type A and BB and BO both give type B, so six genotypes collapse into four phenotypes: A, B, AB, and O.
Part 3 · Sex linkage
A sex-linked locus lies on a sex chromosome. In a selected X-linked model with no corresponding allele on Y, a single X-linked copy can have a different expression pattern from a two-copy genotype. The square follows the stated gamete contributions and trait relationship. It does not imply all traits are X-linked, every organism uses the same chromosome system, or sex/gender characteristics reduce to one allele. Linkage and copy count must be stated rather than borrowed from an autosomal complete-dominance example.
Read the visual model
Identify the labeled structures and units, then trace the arrows or compare values under the caption’s stated conditions. Separate the displayed evidence from a further inference. Write your reasoning before opening the guidance.
Why is an autosomal AA/Aa/aa model not automatically applicable to the single-X condition here?
Visual reasoning — after your attempt
The relevant allele-copy arrangement differs; the locus and chromosome-system assumptions determine the genotype possibilities.
Genes on the sex chromosomes are inherited differently from those on other chromosomes. In humans, individuals with two X chromosomes carry two copies of X-linked genes, while those with one X and one Y carry a single copy of most of them. A recessive allele on the X therefore produces its phenotype whenever it is the only copy present, which makes X-linked recessive conditions more frequently expressed in individuals with one X.
That asymmetry produces recognizable patterns in family records: the trait often appears in males whose mothers show no sign of it, and an affected father cannot pass an X-linked allele to his sons, since he contributes a Y. These patterns are what make a pedigree informative about where a gene sits, not merely about who is affected.
Pause and explain
A father expresses an X-linked recessive trait. Can his sons inherit the allele from him?
Check your reasoning after answering
No. He passes a Y chromosome to his sons, so they cannot receive his X-linked allele from him. All his daughters receive his X and will carry the allele.
Part 4 · Environment enters the phenotype
A genotype–environment relationship describes how a trait’s outcome depends on both inherited and environmental factors. A reaction norm compares a genotype’s outcomes across defined conditions. Different genotypes can respond by different amounts, so their effects need not simply add. Nutrition, light or temperature can change physiology and expression without rewriting every DNA sequence. Avoid using differences in an uncontrolled population to assign a percentage of one individual’s trait to genes versus environment; such an inference needs a carefully defined statistical model.
Read the visual model
Identify the labeled structures and units, then trace the arrows or compare values under the caption’s stated conditions. Separate the displayed evidence from a further inference. Write your reasoning before opening the guidance.
If genotype A changes between conditions, must a new mutation have caused the change?
Visual reasoning — after your attempt
No. Physiological and regulatory responses to conditions can change phenotype without a new sequence change.
Genotype does not fix phenotype on its own. Nutrition influences height, temperature influences coat colour in some mammals and fur patterning in others, sunlight influences skin pigmentation, and in some reptiles incubation temperature determines sex outright. A phenotype is the outcome of a genotype developing under particular conditions.
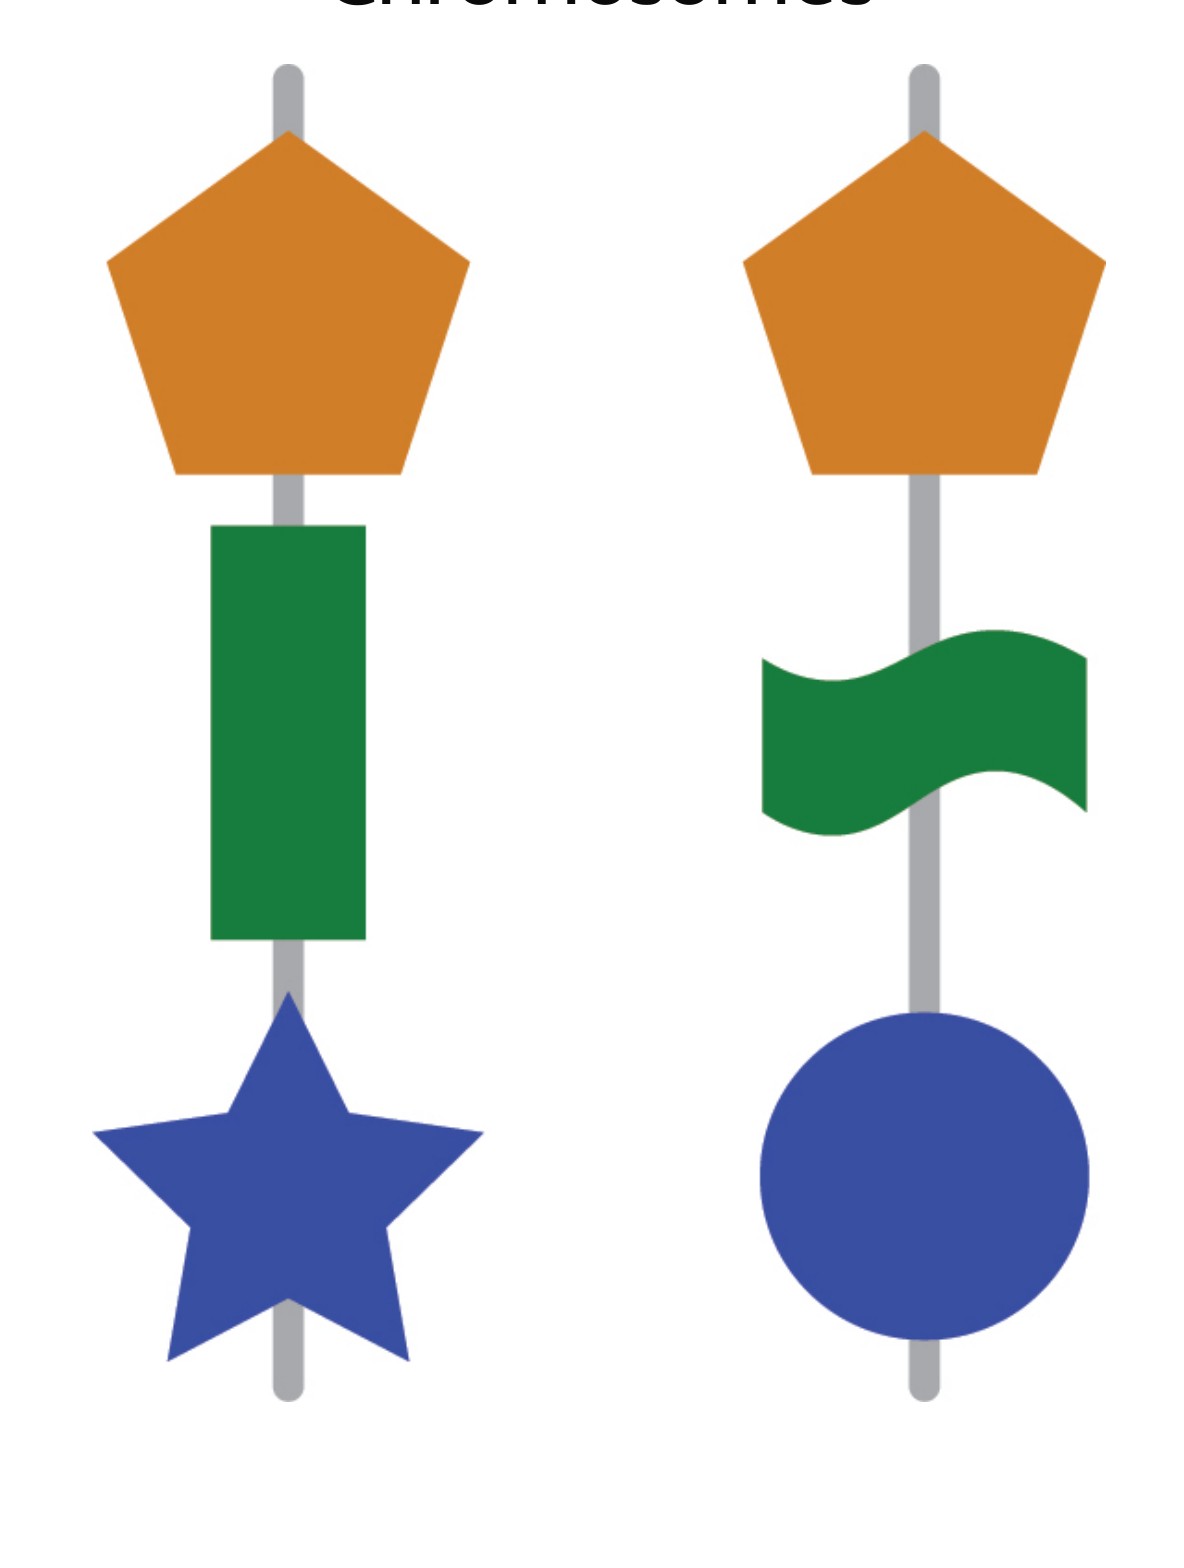
This has a direct consequence for interpreting data. A difference in a measured trait between two groups can arise from genetic differences, environmental differences, or both, so attributing it to inheritance requires evidence that the environments were comparable. Claims that a complex trait is determined by a specific gene typically go well beyond what the data support.
Pause and explain
Two groups of genetically similar plants differ in mean height. What must be established before attributing the difference to inheritance?
Check your reasoning after answering
That the growing conditions were comparable — light, water, nutrients, temperature, and spacing. Without that, the difference may be environmental, and the genetic explanation is not supported.
Apply the whole unit · Resolve four inheritance puzzles
Illustrative records. (i) Red × white flowers of one species give all pink offspring; pink × pink gives 24 red, 51 pink, 25 white. (ii) A mother is blood type O, a father type AB; their four children are types A and B only. (iii) In 40 families, an X-linked recessive condition appears in 11 sons and 0 daughters. (iv) Two genetically identical plant cuttings grown at 15 °C and 25 °C reach mean heights of 22 cm and 41 cm.
Your task
Identify the inheritance pattern or explanation in each case and give the decisive evidence, calculate the observed ratio in case (i) and the proportion of affected sons in case (iii), and state which case shows that phenotype is not determined by genotype alone. Then explain why case (ii) rules out one allele combination entirely.
What your response should show
- Choose the appropriate biological model or relationship and state the conditions it assumes.
- Show the counts, rates, ratios, or intermediate reasoning the question requires.
- Use the supplied evidence to justify the conclusion and separate observation from inference.
- Identify a meaningful limitation, uncertainty, or next measurement.
Response guidance — after your attempt
Case (i): an intermediate phenotype in the heterozygote indicates incomplete dominance; the pink × pink counts of 24:51:25 approximate 1:2:1, matching the genotype ratio because each genotype has its own phenotype.
Case (ii): an O mother contributes only O alleles and an AB father contributes A or B, so children are AO or BO — types A and B, with no AB or O possible.
Case (iii): 11 of the sons affected and no daughters fits X-linked recessive inheritance, since a son with one X expresses a recessive allele carried on it; the proportion is 11 of 40 families, about 28 percent.
Case (iv): genetically identical cuttings differing by 19 cm under different temperatures show an environmental effect on phenotype.
Identify the key case: (iv) demonstrates that genotype alone does not determine phenotype, since the genotypes are identical and the phenotypes are not.
Explain the exclusion in (ii): type O requires two O alleles, and the father has none to give, so no child of this couple can be type O; AB is likewise impossible because the mother cannot contribute A or B.
Case (i) is incomplete dominance: the heterozygote is pink, and the 24:51:25 counts from pink × pink approximate the 1:2:1 genotype ratio, which here is also the phenotype ratio because each genotype looks different. Case (ii) follows from multiple alleles with codominance: the mother can give only O and the father only A or B, so every child is AO or BO — type A or B — and neither type AB nor type O is possible, since AB would need an A or B allele from the mother and O would need an O allele from the father. Case (iii) fits X-linked recessive inheritance, affecting 11 of 40 families' sons and no daughters, because a single X carrying the recessive allele is enough to express it. Case (iv) is the decisive one for the chapter's broader point: genetically identical cuttings differ by 19 cm in mean height under different temperatures, so phenotype is the outcome of a genotype developing under particular conditions rather than a direct readout of the genes.
Scientific references and adapted source figures
- OpenSciEd 8.5 — genetics foundations and case models
- OpenSciEd middle-school source license — CC BY 4.0
Parent / teacher teaching notes
The pattern worth naming aloud is that each of these cases is a departure from one specific assumption in simple Mendelian inheritance — one gene, two alleles, full dominance, and environment held constant — so ask which assumption fails in each. ABO blood type is the best worked example because the exclusions are absolute and checkable. Case (iv) is the one to return to whenever a confident claim about genes determining a complex trait comes up, including outside this course. Ask for an explanation of each label, arrow and axis before calculation. Keep first and revised models; attempt the changed case before consulting guidance. Distinguish invented instructional records from named historical sources. Source chromosome symbols are allele-category models, not DNA sequences. These independently authored high-school supplements are not the full OpenSciEd teacher editions or an endorsement.
The key idea
Choose an inheritance model that fits the trait; probabilities and model limits belong in the explanation.
Worked examples
Example 1
- Gametes from each parent can carry R or W.
- The combinations are RR, RW, RW, WW.
Example 2 · Worked application
- The observed heterozygote is neither identical to one homozygote nor a simultaneous distinct display of both.
- An intermediate phenotype is consistent with incomplete dominance for this trait.
Do not extend one trait's pattern to all traits.
Example 3
- Each parent supplies R or W.
- The combinations RR, RW, WR and WW give ¼ red, ½ pink and ¼ white.
Example 4 · Find and fix the mistake
- Test the claim against the stated conditions: Do not extend one trait's pattern to all traits.
- Many traits involve multiple genes and environmental influences; dominance is not a universal trait explanation.
Do not extend one trait's pattern to all traits.
Example 5 · Reason from the visual evidence
- A sex-linked locus lies on a sex chromosome. In a selected X-linked model with no corresponding allele on Y, a single X-linked copy can have a different expression pattern from a two-copy genotype. The square follows the stated gamete contributions and trait relationship. It does not imply all traits are X-linked, every organism uses the same chromosome system, or sex/gender characteristics reduce to one allele. Linkage and copy count must be stated rather than borrowed from an autosomal complete-dominance example.
- The relevant allele-copy arrangement differs; the locus and chromosome-system assumptions determine the genotype possibilities.
Original constrained X-linked inheritance model, not a diagnostic pedigree or a complete account of human sex development.
Avoid these mistakes
- An individual usually does not carry every allele that exists in the population.
Check your understanding
A hypothetical flower has RR red, WW white and RW pink. Cross RW with RW.
Discuss the answer
1:2:1 phenotype ratio under the stated incomplete-dominance model.
Why must the allele-to-phenotype relationship be specified before using a Punnett square?
Discuss the answer
The same genotype probabilities produce different phenotype probabilities under complete, incomplete or codominant mappings; environmental and multi-locus conditions also matter.
Return to the phenomenon
Return to the initial case. Why can a heterozygote look intermediate without its alleles permanently blending? Revise your drawing or explanation using two named ideas and one stated limitation.
Compare explanations after your attempt
Inheritance predicts outcomes only with a stated genotype–phenotype model; multiple loci, chromosome systems and environment can change it.
What should we investigate next?
Which comparison would test a remaining uncertainty? State what you would change, keep comparable and measure.
Investigate, explain and revise
Complete these tasks after the teaching parts. Preserve your first model and a supported revision; use guidance after a real attempt.
Activity 1 · Return to the opening case
Use the opening question, defined terms, Parts 1–4 and your notebook. The supplied-data route needs no equipment or external account.
Your task
Return to the initial case. Why can a heterozygote look intermediate without its alleles permanently blending? Revise your drawing or explanation using two named ideas and one stated limitation.
Success criteria
- Use relevant stated observations.
- Explain the mechanism with a labeled model.
- Distinguish quantities and assumptions.
- Describe a revision and a useful next test.
Hint
Follow objects, materials and information separately. Check what each measured quantity means.
Response guidance — discuss after your attempt
Inheritance predicts outcomes only with a stated genotype–phenotype model; multiple loci, chromosome systems and environment can change it.
Activity 2 · Transfer to a changed case
Cover the worked guidance and use the unit explanations/figures to solve a changed problem.
Your task
A heterozygote has an intermediate phenotype under an incomplete-dominance model. Predict genotype and phenotype probabilities from Rr×Rr and explain what happens to the alleles.
Success criteria
- Use the stated measurements or conditions, with correct units.
- Connect the result to the biological mechanism or evidence relationship.
- Identify the assumption, model limit or further evidence requested.
Hint
Name the stated conditions, select the relevant mechanism and show intermediate reasoning.
Response guidance — discuss after your attempt
Genotypes are 1/4 RR, 1/2 Rr, 1/4 rr, giving three phenotype categories in the same ratio under this model. The alleles remain distinct and segregate; the intermediate appearance does not erase them.
Words to know
- incomplete dominance
- A heterozygous phenotype is intermediate in the stated model.
- codominance
- Both allelic products are detectably expressed in a heterozygote.
- polygenic trait
- A trait influenced by variation at multiple genes.
In the real world
Exit check
What does a Punnett-square prediction need to be useful?
Check your explanation after answering
Known parental genotypes and an explicit inheritance model, with probabilities rather than guaranteed outcomes.
Explain your reasoning without notes. If a key idea is missing, revisit the lesson and try again.
Gene Regulation, Mutation & Biotechnology
Learning goals
- I can connect changes in DNA or regulation with possible protein effects.
- I can evaluate a biotechnology claim using evidence and limitations.
Readings for this unit
Before this unit
Know transcription and distinguish inherited sequence from expression.
Use three flexible study sessions: core explanation and Parts 1–2; Parts 3–4 with their reasoning checks and models; then the whole-unit application, worked examples, independent practice, and exit check. Allow about 50–60 minutes per session, including diagrams, data work, and notebook explanations. Attempt each check before opening its guidance. Schedule chapter investigations, review, and exams separately; add time where prerequisites are uncertain. Trace the explained visual parts and write a first model, then attempt the illustrated and changed independent cases. In the third session explain a correction and revise the opening account using evidence.
Start with something to explain
Can a trait change without a change in a protein’s amino-acid sequence?
Illustrative evidence case. A regulatory model changes expression timing or amount while preserving coding sequence.
Notice and wonder
Record two observations using the stated quantities or relationships. Keep observations separate from possible causes. Write one question that a new measurement could help answer.
Can a trait change without a change in a protein’s amino-acid sequence?
Your first model
Connect the regulatory input, measured RNA/protein and tested function.
Build the language from the idea
- mutation
- A change in genetic sequence.
- regulatory sequence
- DNA that helps control how a gene is expressed.
- genetic engineering
- Intentional modification or introduction of genetic material using biotechnology.
A gene can be regulated at several stages, including whether RNA is made and how products are processed. Different expression levels can change a cell’s protein supply without changing the underlying DNA sequence. A useful model distinguishes the sequence, its expression, the product, and the resulting trait.
Mutations are sequence changes that can have different consequences. Some do not alter an amino acid; some alter protein sequence or regulation; some have little measurable effect in the tested context. A change in a body cell is not automatically passed to offspring. Heritable variation requires transmission through the relevant reproductive lineage.
Biotechnology can analyze or alter biological information. Comparing DNA fragments or sequencing can test specific questions, but a partial match does not establish every trait. Genetic engineering can introduce or modify a sequence; outcomes depend on expression, cellular context, and other factors. Evaluate benefits, risks, controls, and evidence for the claimed result rather than assuming any edited DNA guarantees improvement.
Gene regulation changes when and how much a gene product is made. Signals can influence transcription or later steps. An expression change need not be a DNA mutation, and a mutation need not change expression in every tissue.
Mutations can arise from copying errors or damage and have different effects depending on location and context. Only changes reaching the reproductive lineage can generally be inherited by offspring in the standard animal model. A skin-cell mutation is not automatically transmitted to children.
Biotechnology uses tools to measure or alter biological systems. A test or intervention needs controls, validation and clear interpretation. Detecting a DNA variant alone does not establish its effect, and intended edits must be checked for accuracy, context and possible unintended consequences.
Build your understanding
Use three flexible study sessions: core explanation and Parts 1–2; Parts 3–4 with their reasoning checks and models; then the whole-unit application, worked examples, independent practice, and exit check. Allow about 50–60 minutes per session, including diagrams, data work, and notebook explanations. Attempt each check before opening its guidance. Schedule chapter investigations, review, and exams separately; add time where prerequisites are uncertain.
Part 1 · Having a gene and using it are different
Gene regulation changes when, where and how strongly a gene product is made or used. Regulatory regions and interacting molecules influence transcription; RNA processing, degradation, translation and protein turnover add other control stages. A DNA sequence can be present while little product is made under one condition. An inducer changes a relevant regulatory state rather than supplying a brand-new copy of every gene. To explain expression differences, identify the measured stage and test the proposed control relationship.
Read the visual model
Identify the labeled structures and units, then trace the arrows or compare values under the caption’s stated conditions. Separate the displayed evidence from a further inference. Write your reasoning before opening the guidance.
Does little RNA detected establish that the gene is absent from the genome?
Visual reasoning — after your attempt
No. Expression can be low, transient or outside the sampled condition while the DNA remains present.
A cell transcribes only a fraction of its genes at any moment. Regulatory sequences near a gene act as control points where proteins bind to promote or block transcription, so the cell's conditions determine which genes are read. This is the mechanism behind differentiation, and it is also how a single-celled organism responds to its environment.
The classic demonstration is a bacterium that produces a sugar-digesting enzyme only when that sugar is available. The gene is present at all times; its transcription is switched on by the sugar's presence. Separating gene content from gene expression is the central idea of this unit, and it is what makes a genome a repertoire rather than a fixed programme.
Pause and explain
Why is it an advantage for a cell to regulate transcription rather than making every protein continuously?
Check your reasoning after answering
Synthesis costs materials and energy. Making a protein when it cannot be used wastes both, so regulating transcription lets the cell invest only in what current conditions require.
Part 2 · Mutations in regulation against mutations in coding
A regulatory variant can influence expression without altering the encoded amino-acid sequence, while a coding variant can change translation outcomes. Both labels cover many possibilities: some variants have no detectable effect in a tested condition. A comparison should measure appropriate RNA/protein quantities and function, with suitable controls and genetic backgrounds. Finding a variant near a trait is an association rather than a complete mechanism; linked variation, environmental differences and measurement choices can provide alternatives.
Read the visual model
Identify the labeled structures and units, then trace the arrows or compare values under the caption’s stated conditions. Separate the displayed evidence from a further inference. Write your reasoning before opening the guidance.
Could protein amount change while its amino-acid sequence stays the same?
Visual reasoning — after your attempt
Yes. Regulation, translation efficiency or turnover can change amount without changing the coding sequence.
A mutation can change a protein's sequence, or it can change when and how much of a normal protein is made. A change in a coding region may alter an amino acid; a change in a regulatory sequence may leave the protein unaltered while causing it to be produced at the wrong time, in the wrong tissue, or in the wrong quantity. Both are heritable changes in DNA with quite different consequences.
This distinction explains observations that otherwise look contradictory — two individuals with identical coding sequences for a gene but different amounts of its protein, for instance. It also underlies much of the difference between related species: changes in when and where genes are expressed can produce substantial differences in form without changes to the proteins themselves.
Pause and explain
Two individuals have identical coding sequences for a gene but very different amounts of its protein. Where should you look for the cause?
Check your reasoning after answering
In the regulatory sequences controlling that gene's transcription, or in the proteins that bind them. The coding sequence determines the protein's structure, not how much of it is made.
Part 3 · Using regulation and sequence deliberately
Biotechnology uses biological processes or components for a defined purpose. Sequencing, selective breeding and molecular editing are different approaches with different mechanisms. A designed sequence must be delivered, expressed and evaluated in the relevant organism/context. Off-target effects are unintended changes or interactions beyond the desired target, and broader ecological or ethical questions require additional evidence and values. A classroom model should compare purpose, method, measured function and limitations; it is not a home genetic-modification protocol.
Read the visual model
Identify the labeled structures and units, then trace the arrows or compare values under the caption’s stated conditions. Separate the displayed evidence from a further inference. Write your reasoning before opening the guidance.
Does detection of an intended edit establish its desired function and all downstream effects?
Visual reasoning — after your attempt
No. Expression, function, unintended effects and relevant system outcomes need independent evaluation.
Techniques in common use rest on the mechanisms of the previous units. Selective breeding changes allele frequencies over generations by choosing which individuals reproduce. Genetic engineering inserts a gene, with regulatory sequences, into another organism so that it is transcribed there. The polymerase chain reaction copies a chosen DNA segment repeatedly, and gel electrophoresis separates DNA fragments by length so that they can be compared.
Each technique also has limits worth stating. Selective breeding acts only on variation already present. An inserted gene is expressed only if its regulatory sequences work in the host. A gel compares fragment lengths, which supports identification but does not by itself establish function. Knowing what a method measures is the difference between using a result and overreading it.
Pause and explain
A gene is inserted into a host organism and no protein appears. Give two explanations that do not involve the gene being absent.
Check your reasoning after answering
The regulatory sequences may not function in the host, so the gene is present but not transcribed. Alternatively the transcript may be made but not translated or the protein may be degraded quickly, so a functional product does not accumulate.
Part 4 · Reading induction data
An induction time course measures a selected expression output after a defined input. The supplied treated signal rises while a comparison remains stable, supporting a condition-dependent response. This does not show that the cell’s DNA sequence changed, nor does RNA signal prove an identical protein increase. Normalization, sample composition, timing and assay behavior can affect the record. Identify whether the response is per cell or total sample, then compare intermediate and functional measurements before assigning a mechanism.
Read the visual model
Identify the labeled structures and units, then trace the arrows or compare values under the caption’s stated conditions. Separate the displayed evidence from a further inference. Write your reasoning before opening the guidance.
Does the rising expression curve demonstrate that a mutation occurred after the inducer was added?
Visual reasoning — after your attempt
No. Regulation can change gene use without changing sequence; mutation would require suitable sequence evidence.
Regulation is measured by changing a condition and following the output. Adding an inducing substance and recording enzyme activity over time gives a curve that rises after a lag, reflecting the time required for transcription and translation. The size of the rise distinguishes a gene being switched on from one already active and merely adjusted.
Controls decide the interpretation. A culture without the inducer shows the baseline, and a culture given the inducer plus a transcription blocker shows whether the response requires new transcription. Without those comparisons, a rise in activity could be explained by growth of the culture or by activation of enzyme already present, rather than by new gene expression.
Pause and explain
Why include a culture treated with the inducer and a transcription blocker?
Check your reasoning after answering
It tests whether the increase in activity requires new transcription. If the rise disappears when transcription is blocked, the response is due to genes being switched on rather than to existing enzyme being activated or to the culture simply growing.
Apply the whole unit · Decide whether a gene was switched on
Illustrative enzyme activity in arbitrary units from four bacterial cultures of equal cell density, measured 0, 20, 40 and 60 minutes after treatment. Culture 1 (no inducer): 4, 4, 5, 4. Culture 2 (inducer added): 4, 31, 78, 96. Culture 3 (inducer plus a transcription blocker): 4, 5, 5, 6. Culture 4 (inducer, cells heat-killed before treatment): 0, 0, 0, 0.
Your task
Calculate the fold change in each culture over the hour, state what each of the four cultures establishes, and conclude whether the response required new transcription. Then explain why the lag before activity rises in Culture 2 is expected rather than anomalous, and name one measurement that would confirm your conclusion at the level of the transcript.
What your response should show
- Choose the appropriate biological model or relationship and state the conditions it assumes.
- Show the counts, rates, ratios, or intermediate reasoning the question requires.
- Use the supplied evidence to justify the conclusion and separate observation from inference.
- Identify a meaningful limitation, uncertainty, or next measurement.
Response guidance — after your attempt
Fold changes: Culture 1 is 4 to 4, about 1.0; Culture 2 is 4 to 96, a 24-fold rise; Culture 3 is 4 to 6, about 1.5; Culture 4 remains 0.
Culture 1 establishes the baseline: without the inducer, activity does not change, so the rise in Culture 2 is a response to the inducer rather than to time or handling.
Culture 3 establishes the mechanism: blocking transcription abolishes almost all of the rise, so the response depends on new transcription rather than on activating enzyme already present.
Culture 4 establishes that living cells are required, ruling out a chemical reaction between the inducer and the medium or the assay.
Conclude: the inducer switched on transcription of the gene, producing a 24-fold increase in enzyme activity within an hour.
Explain the lag: transcription and translation take time, so activity cannot rise the instant the inducer arrives; the gradual increase from 31 to 96 units reflects accumulating enzyme.
Confirm at the transcript level: measure the gene's messenger RNA over the same period and show that it rises before enzyme activity does and that the blocker prevents that rise.
Activity rose 24-fold in the induced culture, from 4 to 96 units, while the uninduced culture stayed flat at about 4, the transcription-blocked culture rose only from 4 to 6, and the heat-killed culture showed nothing at all. Together these establish that the increase required the inducer, required living cells, and required new transcription, so the inducer switched the gene on rather than activating enzyme that was already present. The lag before activity climbs is expected, because transcription and translation take time and enzyme accumulates gradually — an instantaneous rise would in fact suggest activation of existing protein rather than new expression. Measuring the gene's messenger RNA across the same hour would confirm the conclusion directly: the transcript should rise before enzyme activity and should fail to rise when transcription is blocked.
Scientific references and adapted source figures
Parent / teacher teaching notes
The idea to secure is that a genome is a repertoire rather than a fixed programme, and the induction data make that concrete rather than abstract. Spend the time on the control cultures: the transcription-blocked culture is what converts "activity went up" into "a gene was switched on," and recognizing that is the chapter's real skill. On biotechnology, keep each technique paired with what it does not establish — a gel compares lengths, not functions — which is the same honesty the course asks for everywhere else. Ask for an explanation of each label, arrow and axis before calculation. Keep first and revised models; attempt the changed case before consulting guidance. Distinguish invented instructional records from named historical sources. Source chromosome symbols are allele-category models, not DNA sequences. These independently authored high-school supplements are not the full OpenSciEd teacher editions or an endorsement.
The key idea
Follow the evidence from DNA or regulation to product and phenotype; not every sequence change has the same consequence.
Worked examples
Example 1
- The sequence need not have changed.
- Regulation or RNA stability could differ.
- More evidence is needed to connect RNA amount to protein and function.
Example 2 · Worked application
- The amount of RNA produced changes.
- No DNA sequence change is described.
- This is altered gene expression, not a sequence mutation in the scenario.
Expression amount and DNA sequence are different measurements.
Example 3
- The described change is in gene use.
- A mutation would require a sequence change, which the prompt excludes.
Example 4 · Find and fix the mistake
- Test the claim against the stated conditions: Expression amount and DNA sequence are different measurements.
- Signals can change expression or protein activity without a sequence change.
Expression amount and DNA sequence are different measurements.
Example 5 · Reason from the visual evidence
- Biotechnology uses biological processes or components for a defined purpose. Sequencing, selective breeding and molecular editing are different approaches with different mechanisms. A designed sequence must be delivered, expressed and evaluated in the relevant organism/context. Off-target effects are unintended changes or interactions beyond the desired target, and broader ecological or ethical questions require additional evidence and values. A classroom model should compare purpose, method, measured function and limitations; it is not a home genetic-modification protocol.
- No. Expression, function, unintended effects and relevant system outcomes need independent evaluation.
Original biotechnology-evaluation chain, not laboratory operating instructions or a safety approval.
Avoid these mistakes
- Changed gene expression is not automatically a changed DNA sequence.
Check your understanding
A liver cell increases transcription after a hormone signal without changing DNA sequence. Is this a mutation?
Discuss the answer
No; it is regulation of expression in the supplied scenario.
Why does finding a DNA variant not by itself establish its effect on a trait?
Discuss the answer
A variant can be linked to other causes or have no detectable effect. Measure regulation, protein properties and trait outcomes with suitable controls to test the proposed causal relationship.
Return to the phenomenon
Return to the initial case. Can a trait change without a change in a protein’s amino-acid sequence? Revise your drawing or explanation using two named ideas and one stated limitation.
Compare explanations after your attempt
Gene activity and sequence are different; biological engineering and trait explanations need intermediate, functional and system evidence.
What should we investigate next?
Which comparison would test a remaining uncertainty? State what you would change, keep comparable and measure.
Investigate, explain and revise
Complete these tasks after the teaching parts. Preserve your first model and a supported revision; use guidance after a real attempt.
Activity 1 · Return to the opening case
Use the opening question, defined terms, Parts 1–4 and your notebook. The supplied-data route needs no equipment or external account.
Your task
Return to the initial case. Can a trait change without a change in a protein’s amino-acid sequence? Revise your drawing or explanation using two named ideas and one stated limitation.
Success criteria
- Use relevant stated observations.
- Explain the mechanism with a labeled model.
- Distinguish quantities and assumptions.
- Describe a revision and a useful next test.
Hint
Follow objects, materials and information separately. Check what each measured quantity means.
Response guidance — discuss after your attempt
Gene activity and sequence are different; biological engineering and trait explanations need intermediate, functional and system evidence.
Activity 2 · Transfer to a changed case
Cover the worked guidance and use the unit explanations/figures to solve a changed problem.
Your task
A regulatory-region variant is associated with lower RNA but unchanged encoded amino-acid sequence. Explain a possible mechanism and two further tests needed for a causal trait claim.
Success criteria
- Use the stated measurements or conditions, with correct units.
- Connect the result to the biological mechanism or evidence relationship.
- Identify the assumption, model limit or further evidence requested.
Hint
Name the stated conditions, select the relevant mechanism and show intermediate reasoning.
Response guidance — discuss after your attempt
It may reduce transcription or another regulatory process without changing the polypeptide sequence. Use matched genetic backgrounds/controls, protein amount/activity measurements and an appropriate trait test to examine causality and alternatives.
Words to know
- mutation
- A change in genetic sequence.
- regulatory sequence
- DNA that helps control how a gene is expressed.
- genetic engineering
- Intentional modification or introduction of genetic material using biotechnology.
In the real world
Exit check
Why can a DNA change be real while a claimed benefit remains uncertain?
Check your explanation after answering
Sequence confirmation does not alone establish expression, phenotype, environmental performance, or tradeoffs.
Explain your reasoning without notes. If a key idea is missing, revisit the lesson and try again.
Problem 1
Answer and explanation
T-A-C-C-G-T
Apply the base-pairing rules to each base (A-T, C-G): A to T, T to A, G to C, G to C, C to G, A to T. Reading in order gives the complementary strand T-A-C-C-G-T.
Problem 2
Answer and explanation
A pairs with T and C pairs with G; because each base has only one partner, one strand's sequence determines the other's exactly.
In DNA, adenine always pairs with thymine (A-T) and cytosine always pairs with guanine (C-G). Because each base bonds with only one specific partner, the order of bases on one strand automatically fixes the order on the other — so a single strand carries all the information needed to rebuild its complement.
Problem 3
Answer and explanation
Transcription happens in the nucleus; translation happens at a ribosome in the cytoplasm.
Transcription copies DNA into mRNA inside the nucleus, where the DNA is kept. The mRNA then leaves the nucleus and travels to a ribosome in the cytoplasm, where translation reads it to build a protein.
Problem 4
Answer and explanation
10 amino acids
The ribosome reads mRNA in codons of 3 bases, and each codon codes for one amino acid. So 30 bases / 3 bases per codon = 10 codons = 10 amino acids.
Problem 5
Answer and explanation
Genotype 1 BB : 2 Bb : 1 bb; phenotype 3 black : 1 white.
The Bb x Bb Punnett square gives the boxes BB, Bb, Bb, bb. That is a 1:2:1 genotype ratio. Since B is dominant, BB, Bb, and Bb are all black and only bb is white, giving a 3:1 (black:white) phenotype ratio.
Problem 6
Answer and explanation
Recessive descendants establish Tt under the stated model; a small all-tall sample does not prove TT.
Cross with tt. A Tt parent has a chance of all tall descendants in a small sample, so more outcomes or genotype evidence may be needed.
Problem 7
Answer and explanation
1/64
For each child, a Bb x Bb cross gives a 1/4 chance of bb. Each birth is independent, so multiply: 1/4 x 1/4 x 1/4 = 1/64. (That is about 1.6%.)
Problem 8
Answer and explanation
Each parent can supply a. Their combination produces aa under the model.
Meiosis separates the modeled alleles into gametes; fertilization can combine a from each parent. This is a hypothetical single-locus example, not an accurate literal model of human eye color or every trait.
Problem 9
Answer and explanation
19 %
T = A = 31 percent, so A and T together are 62 percent, leaving 38 percent for G and C, which are equal: 19 percent each.
Problem 10
Answer and explanation
Each base pairs with only one partner, so an existing strand specifies the sequence of the strand built against it; the template carries the information needed to reconstruct its complement exactly. Errors still occur because pairing is not perfect in practice: an incorrect base is occasionally inserted, and repair mechanisms catch most but not all of these. Those uncorrected changes are mutations, which is why replication is highly accurate rather than infallible.
Response criteria
- State a biologically accurate conclusion.
- Show the data, mechanism, or calculation that supports it.
- Include units, conditions, or limits where relevant.
Problem 11
Answer and explanation
The directly paired complement is 3′-TTGCAA-5′. Each resulting duplex has one old template strand and one newly synthesized partner in the ideal model.
The directly paired complement is 3′-TTGCAA-5′. Each resulting duplex has one old template strand and one newly synthesized partner in the ideal model.
Response criteria
- Use the stated measurements or conditions, with correct units.
- Connect the result to the biological mechanism or evidence relationship.
- Identify the assumption, model limit or further evidence requested.
Problem 12
Answer and explanation
123
40 amino acids need 40 codons, plus one stop codon gives 41 codons, and 41 × 3 = 123 bases.
Problem 13
Answer and explanation
In the nucleus, the gene's DNA is transcribed into messenger RNA by complementary base pairing, with uracil replacing thymine. The messenger RNA moves to a ribosome in the cytoplasm, where translation reads it three bases at a time; transfer RNA molecules bearing matching anticodons deliver the specified amino acids, which are joined into a polypeptide chain. The chain folds into its three-dimensional shape, and in a secreted protein the endoplasmic reticulum and Golgi apparatus then modify and sort it. Function depends on the final folded shape, not on the sequence alone.
Response criteria
- State a biologically accurate conclusion.
- Show the data, mechanism, or calculation that supports it.
- Include units, conditions, or limits where relevant.
Problem 14
Answer and explanation
GCU retains alanine; GUA specifies valine. Regulatory context, protein folding/activity and other biological conditions determine downstream effects, so a measured trait needs additional evidence.
GCU retains alanine; GUA specifies valine. Regulatory context, protein folding/activity and other biological conditions determine downstream effects, so a measured trait needs additional evidence.
Response criteria
- Use the stated measurements or conditions, with correct units.
- Connect the result to the biological mechanism or evidence relationship.
- Identify the assumption, model limit or further evidence requested.
Problem 15
Answer and explanation
42
Half are expected to be tt: 0.5 × 84 = 42.
Problem 16
Answer and explanation
Each conception is independent, so the probability for the fourth child is the same three quarters dominant and one quarter recessive as for the first. Previous outcomes do not change which gametes happen to meet. The 3:1 ratio is an expectation for large numbers, and small families routinely depart from it; three recessive children in a row has a probability of about one in 64, which is unlikely but not evidence that the ratio is wrong.
Response criteria
- State a biologically accurate conclusion.
- Show the data, mechanism, or calculation that supports it.
- Include units, conditions, or limits where relevant.
Problem 17
Answer and explanation
Expected aa count is 60×1/2=30. The probability of three Aa outcomes is (1/2)³=1/8. Neither expectation forces a specific finite family outcome.
Expected aa count is 60×1/2=30. The probability of three Aa outcomes is (1/2)³=1/8. Neither expectation forces a specific finite family outcome.
Response criteria
- Use the stated measurements or conditions, with correct units.
- Connect the result to the biological mechanism or evidence relationship.
- Identify the assumption, model limit or further evidence requested.
Problem 18
Answer and explanation
A polygenic trait depends on several loci, and conditions such as nutrition can affect growth. One genotype does not specify every phenotypic detail.
Problem 19
Answer and explanation
Continuous variation indicates a polygenic trait: many genes each contribute a small amount, so their combined effects produce a graded range rather than discrete classes, and environmental factors such as nutrition add further variation. A Punnett square handles one or two genes with a few alleles and produces discrete categories, so it cannot represent the many small contributions or the environmental component. Describing the distribution of the trait in a population is more informative than predicting an individual's value.
Response criteria
- State a biologically accurate conclusion.
- Show the data, mechanism, or calculation that supports it.
- Include units, conditions, or limits where relevant.
Problem 20
Answer and explanation
8
2³ = 8 combinations, which is why even a modest number of contributing genes produces a wide range of phenotypes.
Problem 21
Answer and explanation
Genotypes are 1/4 RR, 1/2 Rr, 1/4 rr, giving three phenotype categories in the same ratio under this model. The alleles remain distinct and segregate; the intermediate appearance does not erase them.
Genotypes are 1/4 RR, 1/2 Rr, 1/4 rr, giving three phenotype categories in the same ratio under this model. The alleles remain distinct and segregate; the intermediate appearance does not erase them.
Response criteria
- Use the stated measurements or conditions, with correct units.
- Connect the result to the biological mechanism or evidence relationship.
- Identify the assumption, model limit or further evidence requested.
Problem 22
Answer and explanation
Regulatory change → changed RNA production → altered protein amount → changed cellular process → measured trait; test each link and alternatives.
Problem 23
Answer and explanation
Making the enzyme requires materials and energy, so producing it when the sugar is absent would waste both. Regulating transcription in response to the sugar's presence means the cell invests only when the enzyme can be used. The general principle is that having a gene and expressing it are separate matters: a cell adjusts which genes are transcribed according to its conditions, which is why two cells with the same genome can behave differently.
Response criteria
- State a biologically accurate conclusion.
- Show the data, mechanism, or calculation that supports it.
- Include units, conditions, or limits where relevant.
Problem 24
Answer and explanation
24
96 / 4 = 24 times, the kind of induced change that indicates transcription was switched on rather than merely adjusted.
Problem 25
Answer and explanation
It may reduce transcription or another regulatory process without changing the polypeptide sequence. Use matched genetic backgrounds/controls, protein amount/activity measurements and an appropriate trait test to examine causality and alternatives.
It may reduce transcription or another regulatory process without changing the polypeptide sequence. Use matched genetic backgrounds/controls, protein amount/activity measurements and an appropriate trait test to examine causality and alternatives.
Response criteria
- Use the stated measurements or conditions, with correct units.
- Connect the result to the biological mechanism or evidence relationship.
- Identify the assumption, model limit or further evidence requested.