Ecological Evidence & Environmental Design — Print · Life Science & Scientific Inquiry, Grade 7
Five focused units, a three-session investigation, chapter review, and chapter quiz.
Printable chapter lessons and review.
Interactions & Ecosystem Change
Learning goals
- I can explain interactions & ecosystem change.
- I can use evidence, a model, and stated assumptions to support a biological explanation.
Before this unit
Use the supplied vocabulary, distinguish an observation from an explanation, and identify any units or model assumptions. Revisit a connected earlier unit if needed; new terms are explained here.
Use three flexible 40–45-minute sessions: core background and Parts 1–2 with their checks; Parts 3–4 and the worked application; then remaining practice, a labeled model, revision, and the exit check. Checks completed during reading can count toward the practice set. Read one short part at a time. Investigations and chapter review/quiz have separate sessions, and flexible weeks allow more time.
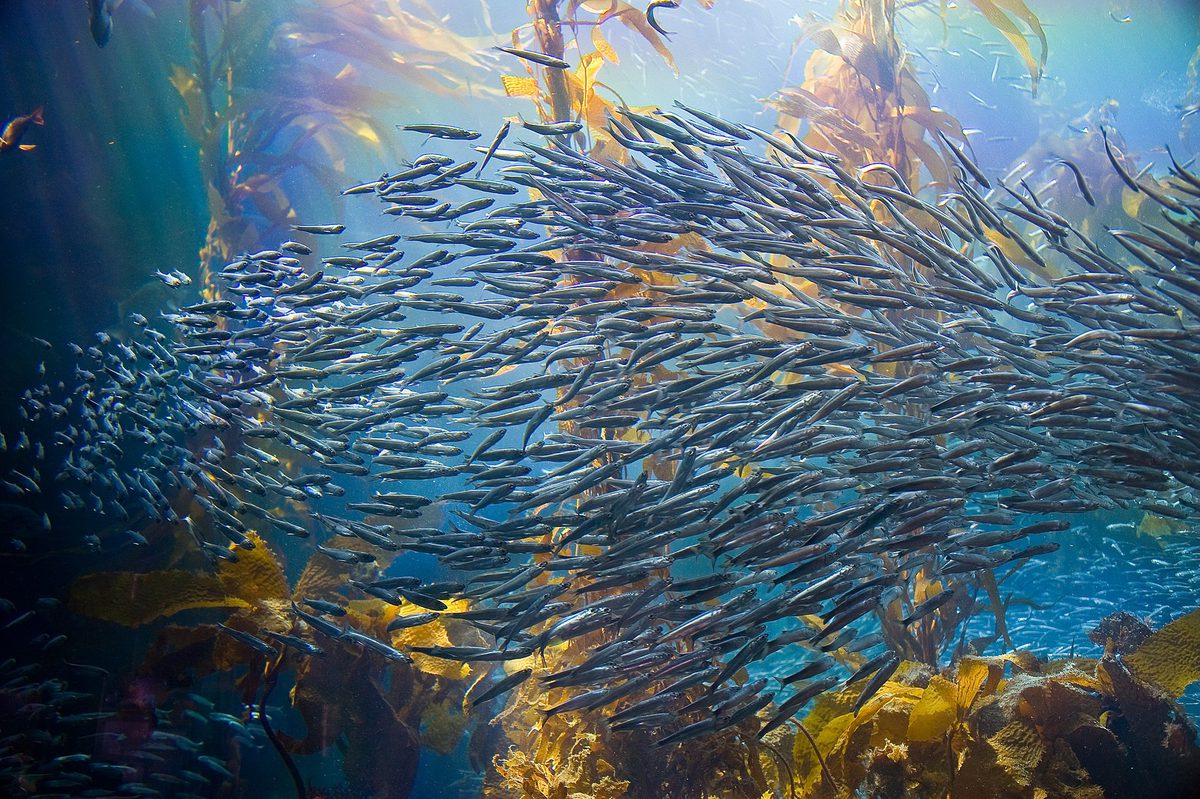
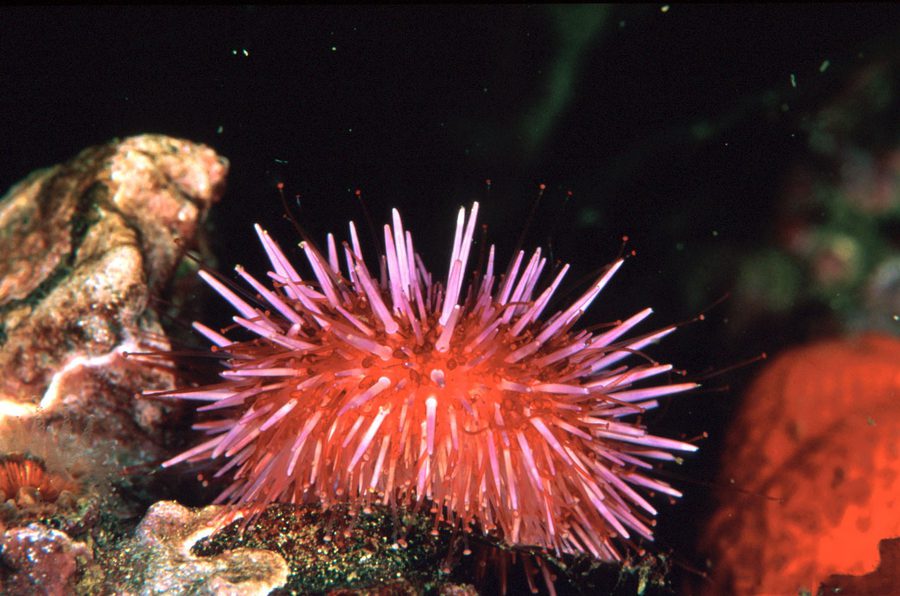
On the Pacific coast of North America, sea otters eat sea urchins, urchins eat kelp, and where otters were hunted out the urchins multiplied and stripped the kelp forests to bare rock. Bring the otters back and the kelp returns. The relationship between otters and kelp is not a feeding one at all — otters do not eat kelp — and yet removing otters destroys kelp forests. Interactions run through networks, and the effect of a species is often on something it never touches.
The kinds of interaction are named by who gains and who loses. Competition is two organisms needing the same limited resource, so both do worse than either would alone. Predation is one organism killing and eating another. Mutualism is a relationship in which both gain — bees and flowering plants, or the fungi that wrap around tree roots and trade minerals for sugars. Parasitism is one gaining at the other's expense without usually killing it quickly. The categories are about outcomes, so the same pair of species can sit in different categories under different conditions.
A disturbance is an event that disrupts a community — a fire, a flood, a storm, a drought, a felling. Disturbances are not simply damage. Many communities are shaped by them, and some species depend on them: seeds that germinate only after fire, plants that need bare ground opened by a flood. What matters for this unit is that a disturbance and a biological interaction can produce the same visible change, which is why a record showing two things happening at once rarely identifies a cause by itself.
Build your understanding
Where this fits
The last chapter followed matter and energy and counted populations. This chapter is about the relationships between species and about using evidence to decide what to do, which is where ecology meets practical judgement. The first unit names the kinds of interaction and shows why separating two plausible causes is the central difficulty.
Use three flexible 40–45-minute sessions: core background and Parts 1–2 with their checks; Parts 3–4 and the worked application; then remaining practice, a labeled model, revision, and the exit check. Checks completed during reading can count toward the practice set. Read one short part at a time. Investigations and chapter review/quiz have separate sessions, and flexible weeks allow more time.
Part 1 · Naming an interaction by its effects
Classify by who gains and who loses, because that is what the categories mean. Both lose: competition. One gains, one is killed: predation. Both gain: mutualism. One gains, one is harmed over time: parasitism. Working from effects rather than from appearances keeps the classification honest for unfamiliar cases.
The categories are not fixed labels on species pairs. A fungus living in a plant's roots may be mutualistic when soil minerals are scarce and the trade is worth it, and closer to parasitic when they are abundant and the plant is paying for nothing. Describing the relationship under stated conditions is more accurate than assigning a permanent category.
Competition is the one most often missed, because nothing visible happens between the competitors. Two plants competing for light do not interact directly at all; each simply does less well than it would alone. The evidence for competition is usually a comparison — how each does with the other present and absent — rather than an observation of anything happening.
Pause and explain
How would you establish that two plant species are competing, given that nothing visible happens between them?
Check your reasoning after answering
By comparison rather than observation. Grow each species alone and together in matched conditions, and compare how each performs. If each does worse with the other present, they are competing for a shared limited resource. The evidence is the difference between the two situations, since competition produces no visible event to watch.
Part 2 · Effects travel through networks
The otter case shows the general pattern: a change in one species propagates through the connections to species it never contacts. Removing otters releases urchins; abundant urchins strip the kelp; losing kelp removes the habitat that many fish and invertebrates depend on. Three steps from a change to an effect, and the first and last species have no direct relationship.
This is why predicting ecological consequences is genuinely hard rather than merely laborious. The paths are multiple, they can partly cancel, and the strengths are usually unknown — which is the limitation the food web unit identified. Effects also arrive with delays, so a change can appear years after its cause.
What follows practically is a habit of tracing paths rather than naming a culprit. When something changes in a community, write out the connections it could act through, ask which of them could produce the observed effect, and look for evidence that distinguishes them. Naming one cause without doing that is usually choosing the most memorable candidate rather than the best supported one.
Pause and explain
Otters do not eat kelp. How can removing otters destroy a kelp forest?
Check your reasoning after answering
Through an intermediate species. Otters eat sea urchins, and urchins eat kelp, so removing otters allows urchin numbers to rise and the urchins strip the kelp. The effect travels along a chain of connections, which is why a species can matter greatly to another it never touches, and why tracing paths matters more than naming direct relationships.
Part 3 · Two things happening at once is not a cause
Suppose records show plant cover falling from 80% to 50% while a herbivore count rises from 10 to 20 — and a drought occurs over the same period. Two explanations are available immediately. Increased herbivory could reduce cover. Drought could limit plant growth. Both are plausible, both are consistent with the record, and the record cannot distinguish them.
It is also likely that both contributed, and in a way that compounds: drought-stressed plants recover more slowly from being grazed, so the same number of herbivores does more damage in a dry year than a wet one. Treating the two as rival explanations where only one can be right is often the wrong framing.
Distinguishing them needs evidence aimed at the question. Fenced plots excluding herbivores, with everything else the same, separate grazing from drought directly. Comparable sites that had the drought without the herbivore increase do the same from the other direction. Soil moisture records establish how severe the drought was. Feeding observations establish what the herbivores actually ate. Each piece targets one of the two, which is what a correlation alone cannot do.
Pause and explain
Plant cover falls while herbivores increase and a drought occurs. What single piece of evidence would best separate the two causes?
Check your reasoning after answering
Fenced plots that exclude the herbivores while leaving everything else the same, including the drought. If cover inside the fences stays high, grazing is the main cause; if it falls similarly, the drought is doing the work. The comparison isolates one factor, which two simultaneous records never can.
Part 4 · Stability, disturbance and recovery
Communities are not static, and stability does not mean unchanging. Populations fluctuate, species move in and out, and conditions vary between years. What ecologists usually mean by a stable community is one that returns to something like its former state after a disturbance rather than shifting permanently.
Many communities are shaped by regular disturbance. Some grasslands depend on grazing or fire to stop trees taking over; some forest species germinate only after a fire has cleared the ground and heated their seeds; floodplain plants need the bare silt a flood leaves behind. Removing a disturbance a community is adapted to changes it as surely as adding one.
Recovery depends on what survived and what can return. Seeds in the soil, roots that resprout, nearby populations that can recolonise — these determine whether a disturbed site returns to what it was. Where those are gone, as with kelp stripped to bare rock over a wide area, the community may settle into a different state that persists, which is why damage and recovery are not symmetrical.
Pause and explain
Why is removing a regular disturbance, such as fire, sometimes as disruptive as adding one?
Check your reasoning after answering
Because communities adapted to regular disturbance depend on it. Some grasslands stay grassland because grazing or fire prevents trees establishing, and some species germinate only after fire has cleared ground and heated their seeds. Remove the disturbance and the community shifts to a different state, which is a change in the same way an added disturbance is.
Apply the whole unit · Assess an interaction claim
Illustrative records, not surveyed data: plant cover falls from 80% to 50% over an interval while a herbivore count rises from 10 to 20. A drought also occurs during the same interval.
Your task
Describe the recorded changes, explain two plausible contributions, and propose evidence that would separate them.
What your response should show
- Explain the relevant biological process accurately.
- Use the supplied evidence and show calculation steps with units where needed.
- Connect a labeled model or mechanism with the claim.
- State an assumption, evidence limitation, or useful next observation.
Response guidance — after your attempt
Describe the changes numerically: cover falls by 30 percentage points, from 80% to 50%, while the herbivore count doubles from 10 to 20.
Give the first plausible contribution: more herbivores grazing more heavily could reduce plant cover directly.
Give the second: drought could limit plant growth and slow recovery, reducing cover with no change in grazing pressure.
Propose evidence that separates them: fenced plots excluding herbivores under the same drought, comparable sites with drought but no herbivore increase, soil moisture records, and feeding observations.
The records show plant cover falling by 30 percentage points, from 80% to 50%, while the herbivore count doubles from 10 to 20, with a drought over the same interval. Two contributions are plausible and the record supports neither over the other. More herbivores could be grazing more plant material, reducing cover directly. Drought could be limiting plant growth and slowing regrowth, reducing cover with no change in grazing at all. It is also likely that both acted together and compounded: a drought-stressed plant recovers more slowly from being grazed, so the same herbivores do more damage in a dry year, which means treating the two as rivals where only one can win may be the wrong framing from the start. Separating them requires evidence aimed at one factor at a time. Fenced plots that exclude herbivores while experiencing the same drought are the most direct test: if cover inside stays high, grazing is doing the work, and if it falls similarly, the drought is. Comparable sites that had the drought without a herbivore increase test it from the other side. Soil moisture records establish how severe the drought actually was rather than assuming it, and feeding observations establish what the herbivores ate and in what quantity. Two further limits are worth stating: the record gives no interval length, so none of these changes can be expressed as a rate, and a single site observed once cannot distinguish an unusual year from a trend.
Scientific references for this unit
Parent / teacher teaching notes
Ask for a because-statement and a labeled relationship, not just a memorized word. Work through one calculation step at a time, permit oral or diagram responses, and use flexible sessions for difficult reading. Compare the learner’s actual evidence with the supplied model; do not reward copying or agreement with a personal preference. No private family, genetic, or medical records are required.
The key idea
Organisms interact through feeding, competition, and other relationships. Predation involves one organism consuming another; competition concerns overlapping use of limited resources. Some relationships benefit both participants, while others benefit one and harm another. The effect must be explained within a defined context rather than assigned by an organism’s reputation.
Worked examples
Example 1 · Classify by outcome, not appearance
- Apply the definitions by outcome: both gaining is mutualism; one gaining at the other's expense is parasitism.
- Assess the mineral-poor case: the tree gains minerals it could not otherwise obtain and pays in sugars, so both gain.
- Assess the mineral-rich case: the tree supplies sugars for a benefit it does not need, so the balance shifts against it.
Classify by who gains and loses now, not by a label attached to the species.
Example 2 · Trace an indirect effect
- Identify what the grazers were doing: cropping young woody plants and keeping the grassland open.
- Follow the first consequence: without grazing, shrubs and tree seedlings establish and grow.
- Follow the second: the open ground the birds needed for nesting is replaced by scrub, so the habitat those species require no longer exists.
Ask what a species was doing to the habitat, not only what it ate.
Avoid these mistakes
- Mistake: a species only affects what it eats. Otters do not eat kelp, and removing them destroys kelp forests through urchins; effects travel along chains.
- Mistake: interaction categories are permanent labels. A root fungus can be mutualistic in poor soil and closer to parasitic in rich soil; describe the relationship under stated conditions.
- Mistake: two things changing together identifies the cause. Rising herbivores and a drought both explain falling cover, and only a comparison that isolates one — such as fenced plots — can separate them.
- Mistake: disturbance is damage. Some grasslands need grazing or fire to remain grassland, and some seeds germinate only after a fire, so removing a disturbance can change a community as much as adding one.
Check your understanding
Does sharing a habitat alone prove competition?
Discuss the answer
No. Resource overlap and limitation, or effects on performance, need evidence.
Why might a predator not fall immediately after one prey declines?
Discuss the answer
Alternative prey, movement, stored resources, and delayed responses can affect its population.
Words to know
- competition
- Two organisms needing the same limited resource, so each does worse than it would alone; the evidence is a comparison, since nothing visible happens between them.
- predation
- One organism killing and eating another; its effects often travel beyond the prey to species the predator never touches.
- mutualism
- A relationship in which both participants gain, such as bees and flowering plants, or root fungi trading minerals for sugars.
- parasitism
- One organism gaining at another's expense over time without usually killing it quickly.
- disturbance
- An event disrupting a community — fire, flood, drought, felling; many communities are shaped by regular disturbance rather than harmed by it.
Extend your scientific explanation
Compare a second supplied example or the linked educational reference. Identify a connection, a model limit, and an additional observation that would test the explanation.
In the real world
Use a clear question, reliable observations, and a biological mechanism to evaluate a claim. State what remains uncertain before applying a classroom model to a different setting.
Exit check
Does recovery require every count to return to its original value?
Check your explanation after answering
Not necessarily. Recovery depends on the defined function or condition; composition and counts can differ.
Explain your reasoning without notes. If a key idea is missing, revisit the lesson and try again.
Biodiversity, Variation & Ecosystem Resilience
Learning goals
- I can explain biodiversity, variation & ecosystem resilience.
- I can use evidence, a model, and stated assumptions to support a biological explanation.
Before this unit
Use the supplied vocabulary, distinguish an observation from an explanation, and identify any units or model assumptions. Revisit a connected earlier unit if needed; new terms are explained here.
Use three flexible 40–45-minute sessions: core background and Parts 1–2 with their checks; Parts 3–4 and the worked application; then remaining practice, a labeled model, revision, and the exit check. Checks completed during reading can count toward the practice set. Read one short part at a time. Investigations and chapter review/quiz have separate sessions, and flexible weeks allow more time.
Two woods, each with a hundred trees of three species. In the first, ninety-eight are beech and there is one oak and one birch. In the second there are thirty-four beech, thirty-three oak and thirty-three birch. Both have three species and a hundred trees, and almost nobody would call them equally diverse. Capturing that difference needs more than one number, and learning which number answers which question is most of this unit.
Biodiversity is the variety of life in a place, and it is measured in at least three ways that can disagree. Species richness is simply how many different species are present — three in both woods above. Abundance is how many individuals there are, of each species or in total — a hundred in both. Evenness is how the individuals are distributed among the species, and that is the one that separates the two woods: the second is even, the first is dominated by one species. A place can be rich and uneven, even and poor, or any combination, so a claim about diversity should say which measure it means.
Diversity matters beyond counting because of resilience — the ability of a community to absorb a disturbance and return to something like its former state. More variety often means more resilience, because alternatives exist: if one species fails, something else can fill its role, which is the food web argument from the last chapter. But the connection is conditional rather than automatic. A community of three hundred species that all depend on one plant is fragile despite its richness, and diversity measured at one place and time cannot by itself establish that a community will withstand whatever comes next.
Build your understanding
Where this fits
The last unit showed effects travelling through a network of relationships. This unit asks what makes such a network more or less able to absorb a change — which means being precise about what diversity is, since the word covers at least three different measurements that can point in different directions.
Use three flexible 40–45-minute sessions: core background and Parts 1–2 with their checks; Parts 3–4 and the worked application; then remaining practice, a labeled model, revision, and the exit check. Checks completed during reading can count toward the practice set. Read one short part at a time. Investigations and chapter review/quiz have separate sessions, and flexible weeks allow more time.
Part 1 · Richness, abundance and evenness are three questions
Richness counts species and ignores numbers: a wood with three species is richer than one with two, whatever the individual counts. Abundance counts individuals and ignores identity. Evenness describes the shape of the distribution — whether individuals are spread across the species or concentrated in one.
Work the comparison. Sample A detects three species with counts of 8, 1 and 1. Sample B detects three species with counts of 4, 3 and 3. Both have richness of three and total abundance of ten. They differ only in evenness: A is dominated by one species that makes up eighty per cent of the individuals; B is close to even.
That difference has consequences. In A, losing the dominant species removes most of the community's individuals and whatever function they performed, while losing one of the singletons removes almost nothing measurable. In B, no single loss is as damaging, and each species is common enough to persist. Two samples with identical richness and abundance describe quite different situations, which is exactly why one number is not enough.
Pause and explain
Samples A and B both detect three species among ten individuals, with counts of 8,1,1 and 4,3,3. How do they differ?
Check your reasoning after answering
In evenness. Richness is three in both and total abundance is ten in both, so those measures cannot distinguish them. A is dominated by one species holding eight of the ten individuals, while B spreads them almost equally. Losing the dominant species would remove most of A's community and no single loss would do that in B.
Part 2 · Diversity within species and across habitats
Counting species is not the only level that matters. Genetic diversity within a species — the range of alleles present, produced by the meiosis and recombination of Chapter 5 — determines whether a population contains individuals able to cope with a new disease or a changed climate. A population of genetically near-identical individuals is vulnerable in exactly the way a monoculture is, however many of them there are.
Habitat diversity is a third level. A landscape with woodland, grassland, wetland and bare ground supports species that need each, and species that need more than one during their life cycle — amphibians breeding in water and living on land, insects whose larvae and adults use different places entirely. Simplifying a landscape reduces diversity even if no species is removed directly.
The three levels interact. Genetic diversity within a species supports its persistence; species diversity supports the community's function; habitat diversity supports both by providing the conditions each needs. A survey counting species in one habitat type measures one level and should say so.
Pause and explain
Why can a population of thousands of genetically near-identical individuals still be vulnerable?
Check your reasoning after answering
Because numbers do not supply variation. If the individuals are genetically near-identical, a disease or change that defeats one defeats all of them, since none carries a different combination that might cope. Genetic diversity within a species is what makes it likely that some individuals survive a new pressure, which is the same argument as for species diversity at the community level.
Part 3 · Resilience is conditional, not guaranteed
The reason diversity is linked to resilience is redundancy. If several species can pollinate a plant, or several can decompose leaf litter, then losing one leaves the function intact. That argument is sound, and it is about functional overlap rather than about the number of species as such.
So richness alone does not guarantee resilience. A community of many species that all depend on a single plant, or all require the same narrow conditions, has little redundancy where it matters. Conversely a community of few species, each robust and able to cover several roles, may absorb a disturbance well. The useful question is whether the functions a community performs have backups.
This also means resilience is specific to what is being resisted. A community can be highly resilient to drought and collapse under a new disease, because the overlaps that cover one do not cover the other. A claim that a diverse community is stable needs to say stable against what, measured how, over what period — otherwise it is a slogan rather than a finding.
Pause and explain
Why does high species richness not guarantee that a community will be resilient?
Check your reasoning after answering
Because resilience comes from functional overlap rather than from species number. Many species that all depend on one plant, or all need the same narrow conditions, provide no backup where it matters. Resilience is also specific: a community can absorb a drought and collapse under a new disease, so a claim needs to say resilient against what.
Part 4 · Comparing interventions with stated criteria
Decisions about land usually involve a choice between options, and diversity measures are one input rather than the answer. The honest way to compare is to state the criteria first — what outcome matters, measured how, over what period and at what cost — and then assess each option against them. Choosing the criteria afterwards is how a preferred option gets justified rather than tested.
Different criteria select different options, legitimately. Maximising species richness, maximising the population of one species of concern, maximising evenness, and minimising cost are four different goals that will rank the same options differently. Saying which you are optimising is part of the proposal, not a detail.
And the measurements have to be comparable. Equal-effort sampling, the same season, the same methods, the same area — otherwise a difference in the numbers may be a difference in how hard anyone looked. The next unit is entirely about that problem, which is the practical foundation under everything in this one.
Pause and explain
Why should the criteria for comparing two land-management options be stated before the options are assessed?
Check your reasoning after answering
Because different criteria rank the options differently — maximum species richness, the population of one species, evenness and cost can each favour a different plan. Choosing criteria after seeing the results allows a preferred option to be justified rather than tested. Stating them first makes the comparison checkable by someone who disagrees.
Apply the whole unit · Compare communities
Illustrative equal-effort samples, not surveyed data: sample A has species counts of 8, 1 and 1; sample B has counts of 4, 3 and 3. Both samples contain ten individuals and three detected species.
Your task
Compare the samples on richness, total abundance and distribution, without claiming that any one number establishes which community is more stable.
What your response should show
- Explain the relevant biological process accurately.
- Use the supplied evidence and show calculation steps with units where needed.
- Connect a labeled model or mechanism with the claim.
- State an assumption, evidence limitation, or useful next observation.
Response guidance — after your attempt
Compare richness: three species detected in each sample, so richness is identical.
Compare total abundance: ten individuals in each, so abundance is identical too.
Compare the distribution: A has one species holding 8 of 10 individuals, while B spreads them 4, 3 and 3 — B is far more even.
State what this cannot establish: evenness at one place and time does not show which community would withstand a particular disturbance.
The two samples are identical on the first two measures and differ on the third. Richness is three species in each, and total abundance is ten individuals in each, so neither of those numbers distinguishes them at all. The difference is in distribution: sample A is dominated by one species holding 8 of the 10 individuals, with two species represented by a single individual each, while sample B spreads its individuals 4, 3 and 3 and is close to even. That difference matters for what a loss would do. In A, losing the dominant species removes 80% of the individuals and whatever function they perform, while losing either singleton removes almost nothing measurable — and a species represented by one individual in a sample may be close to absent in the community anyway. In B, no single loss removes more than 40%, and each species is common enough that the sample is reasonable evidence it is established. What these figures cannot establish is which community is more stable. Resilience depends on functional overlap — whether the remaining species could cover the roles of one that was lost — and on what disturbance is being resisted, neither of which a count at one moment reveals. A community can absorb a drought and collapse under a disease. The samples are also single equal-effort snapshots, so they say nothing about seasonal change, nothing about the genetic diversity within each species, and nothing about species present but not detected.
Scientific references for this unit
Parent / teacher teaching notes
Ask for a because-statement and a labeled relationship, not just a memorized word. Work through one calculation step at a time, permit oral or diagram responses, and use flexible sessions for difficult reading. Compare the learner’s actual evidence with the supplied model; do not reward copying or agreement with a personal preference. No private family, genetic, or medical records are required.
The key idea
Biodiversity includes variety within species, among species, and across ecosystems. Species richness is the number of species detected within a defined survey; abundance describes individual counts. Two communities can have equal richness yet different abundance patterns. Detection method and survey effort influence both measures.
Worked examples
Example 1 · Choose the measure that answers the question
- Identify what dominance means: one species holding a large share of the individuals.
- Match it to a measure: evenness describes how individuals are distributed among species, so it answers directly.
- Check the others: richness counts species and would be the same whether one dominates or not, and total abundance counts individuals regardless of species.
Three measures, three questions. Name the question before choosing the number.
Example 2 · Test a resilience claim
- Identify the mechanism resilience depends on: functional overlap, so that losing one species leaves its role covered.
- Ask whether richness establishes that: it does not, since forty species could all depend on one plant or all need the same conditions.
- Name what resilient against what requires: a specified disturbance, a measured outcome and a period.
Resilience is a claim about a response to something. Ask: to what, measured how?
Avoid these mistakes
- Mistake: diversity is one number. Richness, abundance and evenness answer different questions — 8,1,1 and 4,3,3 match on the first two and differ entirely on the third.
- Mistake: more species always means more resilience. Resilience comes from functional overlap, so forty species all depending on one plant provide little backup.
- Mistake: diversity only means species. Genetic diversity within a species and habitat diversity across a landscape are two further levels, and a survey measures one of them.
- Mistake: a community is simply stable or not. Resilience is specific to a disturbance — a community can absorb a drought and collapse under a disease.
Check your understanding
Can equal individual totals have different richness?
Discuss the answer
Yes. Individuals may belong to different numbers of species.
Does counting species directly measure all genetic diversity?
Discuss the answer
No. Genetic variation within and among populations requires other evidence.
Words to know
- biodiversity
- The variety of life in a place, measured at the level of genes within species, species within communities, and habitats within landscapes.
- species richness
- How many different species are present, regardless of how many individuals each has.
- abundance
- How many individuals there are, in total or of each species; identical to richness in telling you nothing about distribution.
- evenness
- How individuals are spread among the species; 8,1,1 and 4,3,3 have the same richness and abundance and very different evenness.
- resilience
- The ability to absorb a disturbance and return to a similar state; it comes from functional overlap and is specific to what is being resisted.
Extend your scientific explanation
Compare a second supplied example or the linked educational reference. Identify a connection, a model limit, and an additional observation that would test the explanation.
In the real world
Use a clear question, reliable observations, and a biological mechanism to evaluate a claim. State what remains uncertain before applying a classroom model to a different setting.
Exit check
Why distinguish evidence from a decision criterion?
Check your explanation after answering
Evidence describes conditions or effects; a criterion states what the decision seeks to achieve or prioritize.
Explain your reasoning without notes. If a key idea is missing, revisit the lesson and try again.
Human Activities, Habitat & Environmental Evidence
Learning goals
- I can explain human activities, habitat & environmental evidence.
- I can use evidence, a model, and stated assumptions to support a biological explanation.
Before this unit
Use the supplied vocabulary, distinguish an observation from an explanation, and identify any units or model assumptions. Revisit a connected earlier unit if needed; new terms are explained here.
Use three flexible 40–45-minute sessions: core background and Parts 1–2 with their checks; Parts 3–4 and the worked application; then remaining practice, a labeled model, revision, and the exit check. Checks completed during reading can count toward the practice set. Read one short part at a time. Investigations and chapter review/quiz have separate sessions, and flexible weeks allow more time.
Rain falling on a wood and rain falling on a car park do entirely different things. On the wood, leaves intercept some of it, the rest reaches a soil full of pore space and roots and soaks in, and what reaches a stream arrives slowly and filtered. On the car park, almost all of it runs straight off, arriving at the stream within minutes, warm, carrying whatever was on the surface. Nothing about the rain changed. The surface did, and most of what human activity does to ecosystems works through changes of this kind — alterations to habitat and to the pathways matter takes, rather than direct harm to organisms.
Habitat fragmentation is one of the most consequential. A road, a field or a housing development splits a continuous habitat into pieces, and the pieces are not equivalent to the whole. Populations in small patches are more vulnerable to local extinction, individuals cannot move between patches to find mates or recolonise, and a patch has proportionally more edge, where conditions differ from the interior. Species needing large ranges or deep interior conditions can disappear from a landscape that still contains plenty of their habitat in total.
The water pathway is the second big mechanism, and it is measurable. Infiltration is water soaking into the ground; an impervious surface — roof, road, compacted ground — prevents it, sending water to runoff instead. More runoff means faster, higher flows after rain, more erosion, more material washed into watercourses, and less water recharging the ground. Vegetation and soil structure increase infiltration, which is why vegetation treatments are a common intervention. Evaluating any intervention means naming the outcome you are measuring and accepting that there will be a tradeoff — something given up for what is gained.
Build your understanding
Where this fits
The last two units covered how species interact and what makes a community able to absorb change. This unit applies both to the largest source of ecological change there is, and keeps to the same standard of evidence: trace a mechanism, compare fairly, and say what one trial can support.
Use three flexible 40–45-minute sessions: core background and Parts 1–2 with their checks; Parts 3–4 and the worked application; then remaining practice, a labeled model, revision, and the exit check. Checks completed during reading can count toward the practice set. Read one short part at a time. Investigations and chapter review/quiz have separate sessions, and flexible weeks allow more time.
Part 1 · Tracing an impact through a mechanism
Saying that an activity harms an ecosystem is a conclusion without a mechanism, and it is not much use for predicting or for designing a response. The useful version names what physically changed and follows the consequence: this surface no longer absorbs water, so this much more water arrives at the stream within this much less time, so the bank erodes.
Fragmentation is worth tracing carefully because its effects are counter-intuitive. The total area of habitat can stay the same while the population it supports falls sharply, because what matters to many species is patch size and connection rather than area summed across a map. A species needing a large territory may fit in none of the patches although the total would hold many.
Edges matter for the same reason. A patch has a perimeter where light, wind, temperature and humidity differ from the interior, and species adapted to interior conditions lose usable habitat well inside the boundary. Cutting one large patch into four smaller ones of the same total area greatly increases the edge, so the amount of true interior falls even though the map shows the same green.
Pause and explain
How can total habitat area stay the same while the population a landscape supports falls?
Check your reasoning after answering
Because many species depend on patch size and connection rather than on total area. Splitting one large patch into several small ones leaves the total unchanged while making each too small for species needing a large territory, cutting off movement between patches, and greatly increasing the proportion of edge, where conditions differ from the interior that some species require.
Part 2 · Land cover and where the water goes
When rain lands, it either infiltrates or runs off, and the surface decides the split. Vegetated soil with good pore space takes up a great deal, slowly releasing it to groundwater and streams. Compacted bare soil takes up much less. An impervious surface takes up essentially none.
The consequences follow from the speed as much as the volume. Water that soaks in arrives at a stream over hours or days, filtered through soil; water that runs off arrives in minutes, carrying surface material with it, and the stream rises sharply and falls again. That pattern erodes banks, moves sediment, and gives aquatic organisms a much more variable environment than they evolved in.
Interventions therefore aim at infiltration: planting vegetation, breaking up compaction, using permeable surfaces, creating basins where water can stand and soak in. Each works through the same mechanism, which is why an intervention can be evaluated by measuring runoff — a measurable outcome standing in for the thing you care about.
Pause and explain
Why does a paved surface change a stream even when the total rainfall is unchanged?
Check your reasoning after answering
Because it changes the route and the speed. Water that would have soaked in and reached the stream slowly over hours now runs off and arrives within minutes, so the stream rises sharply and falls again rather than flowing steadily. The runoff also carries surface material with it, and less water recharges the ground.
Part 3 · Comparing before and after, and the alternatives
A before-and-after comparison at one site is the weakest useful design, because everything else changed too — the weather, the season, the year. If runoff fell after a planting, the planting is one explanation and a drier year is another, and the comparison cannot separate them.
A matched comparison is much stronger. Two areas with comparable starting conditions receiving the same rain, one treated and one not, isolates the treatment because the weather is shared. That is the design behind the model in this unit: Area A sends 18 L to runoff and Area B, after a vegetation treatment, sends 10 L, a difference of 8 L under matched rain.
Even then, one trial is one trial. A single rainfall event does not establish how the areas compare in a heavier storm, after a dry spell, or in winter, and it does not say whether the areas were genuinely comparable to begin with. Repetition across events and seasons, and ideally several paired areas, is what turns a suggestive result into a finding.
Pause and explain
Why is a matched comparison stronger than measuring the same site before and after a treatment?
Check your reasoning after answering
Because a before-and-after comparison confounds the treatment with everything else that changed, especially the weather. Two comparable areas receiving the same rain, one treated and one not, share the weather, so the difference between them isolates the treatment. One rainfall event is still only one event, and repetition across conditions is what makes it a finding.
Part 4 · Proposals, outcomes and trade-offs
Evaluating a proposal means naming the outcome you are measuring. Runoff volume is measurable and is not the same as water quality, flood risk or ecological condition, though it bears on all three. A result about runoff supports a claim about runoff, and extending it to water quality needs water quality measured — the substances carried, at what concentration, with what effect.
Every intervention has a trade-off, and stating it is part of an honest proposal. Planting takes land out of other uses and needs maintenance. Permeable paving costs more and can clog. A detention basin occupies space and needs managing. None of this argues against doing anything; it argues for comparing options on stated criteria including their costs, which the next unit does explicitly.
The habit to carry out of this unit is the one the whole course has been building. Name the mechanism, design a comparison that isolates it, measure a stated outcome, say what the result supports and what it does not, and name what you gave up. That is as true of a schoolyard planting plan as of a national policy.
Pause and explain
A planting reduces measured runoff. Why does that not establish that it improved water quality?
Check your reasoning after answering
Because runoff volume and water quality are different outcomes. Less runoff plausibly means less material washed into a watercourse, but establishing a water quality claim needs water quality measured — which substances, at what concentration, compared with what. A result supports a claim about the thing that was measured, and extending it needs its own evidence.
Apply the whole unit · Evaluate a runoff comparison
Illustrative matched-rain model, not measured data: Area A sends 18 L to surface runoff and Area B sends 10 L after a vegetation treatment. Starting conditions are stated comparable, and only one trial is supplied.
Your task
Calculate the difference, explain a plausible pathway for it, and qualify a claim that the treatment improves water quality.
What your response should show
- Explain the relevant biological process accurately.
- Use the supplied evidence and show calculation steps with units where needed.
- Connect a labeled model or mechanism with the claim.
- State an assumption, evidence limitation, or useful next observation.
Response guidance — after your attempt
Calculate the difference: 18 L − 10 L = 8 L less runoff recorded from the treated area under the same rain.
Give the mechanism: vegetation and the soil structure beneath it increase infiltration and intercept rain, so less water travels across the surface.
Note the design strength: matched conditions and shared rainfall mean the comparison isolates the treatment better than a before-and-after measurement at one site would.
Qualify the water-quality claim: runoff volume was measured and water quality was not, and one trial cannot establish behaviour in heavier rain or another season.
Area B records 8 L less runoff than Area A, since 18 − 10 = 8 L under the same rainfall. A plausible pathway is straightforward: vegetation intercepts some rain on leaves, roots and organic matter improve the soil's pore space, and both increase infiltration, so a greater share of the water soaks in rather than travelling across the surface. The design is reasonably strong for a single trial, because the two areas are stated to be comparable at the start and received the same rain, which means the weather cannot explain the difference — a before-and-after measurement at one site could not have ruled that out. What the result will not support is a water-quality claim. Runoff volume is what was measured, and water quality is a different outcome requiring its own measurements: which substances are present, at what concentration, and compared with what standard or control. Less runoff plausibly carries less surface material into a watercourse, and plausibly is not evidence. The result is also one trial. It cannot say how the two areas would compare in a heavier storm, when vegetation and soil may saturate, or after a dry spell, or in winter when plants are dormant, and it cannot confirm that the areas were genuinely equivalent in slope, soil and compaction beyond the statement that they were. Repeating across several rainfall events and seasons, with more than one pair of areas, is what would turn this into a finding — and any proposal built on it should state its trade-off, since planting occupies land and requires maintenance.
Scientific references for this unit
Parent / teacher teaching notes
Ask for a because-statement and a labeled relationship, not just a memorized word. Work through one calculation step at a time, permit oral or diagram responses, and use flexible sessions for difficult reading. Compare the learner’s actual evidence with the supplied model; do not reward copying or agreement with a personal preference. No private family, genetic, or medical records are required.
The key idea
Human activities can change habitat, water movement, resource availability, and ecosystem relationships. Roads can divide habitat, land cover can affect runoff, and restoring vegetation can change conditions. Effects vary with design, place, scale, and time. A serious explanation traces a mechanism and observations rather than treating all activities as identical.
Worked examples
Example 1 · Explain a counter-intuitive loss
- Identify what the road did besides removing area: it split one patch into two and created new edge along its length.
- Apply patch size: species needing a large continuous territory may now fit in neither half, though the total would have held them.
- Apply edge effects: light, wind, temperature and humidity differ near an edge, so interior conditions are lost well inside the new boundaries.
Ask about patch size, connection and edge, not only about total area.
Example 2 · Separate measured outcome from the thing cared about
- Identify the measurable mechanism: permeable paving increases infiltration and reduces runoff volume and speed.
- Identify the claim: stream health, which involves organisms, oxygen, temperature, sediment and chemistry.
- Name the gap: runoff is an input to stream health, not a measure of it, so one does not establish the other.
Name the outcome measured and the outcome claimed. If they differ, the gap needs evidence.
Avoid these mistakes
- Mistake: impact means direct harm to organisms. Most impact works through habitat and pathways — a car park changes a stream by changing where rain goes, not by touching anything living.
- Mistake: if the total habitat area is unchanged, nothing is lost. Fragmentation reduces patch size, cuts connections and multiplies edge, so species needing large interiors can disappear.
- Mistake: a before-and-after measurement shows an intervention worked. It confounds the treatment with the weather; matched areas sharing the same rain isolate it.
- Mistake: less runoff means better water quality. Runoff volume is the outcome measured; water quality needs substances and concentrations measured in their own right.
Check your understanding
Why does a mapped barrier not prove an exact population loss?
Discuss the answer
Actual effects depend on movement, species needs, alternative routes, and observations not given by the line alone.
Does clearer water prove every contaminant is absent?
Discuss the answer
No. Some dissolved substances or organisms are not revealed by clarity alone.
Words to know
- habitat fragmentation
- Splitting continuous habitat into pieces; total area can stay the same while patches become too small, disconnected, and mostly edge.
- infiltration
- Water soaking into the ground rather than running across it; vegetation and soil pore space increase it.
- impervious surface
- A roof, road or compacted ground that prevents infiltration, sending water to runoff within minutes rather than hours.
- outcome
- The specific thing measured in an evaluation; a result about runoff volume supports a claim about runoff volume.
- tradeoff
- What an intervention costs or gives up for what it gains; stating it is part of an honest proposal rather than an admission.
Extend your scientific explanation
Compare a second supplied example or the linked educational reference. Identify a connection, a model limit, and an additional observation that would test the explanation.
In the real world
Use a clear question, reliable observations, and a biological mechanism to evaluate a claim. State what remains uncertain before applying a classroom model to a different setting.
Exit check
Can two different recommendations both be well supported?
Check your explanation after answering
Yes, if they use evidence accurately, state criteria and constraints, and explain tradeoffs and uncertainty.
Explain your reasoning without notes. If a key idea is missing, revisit the lesson and try again.
Sampling Ecosystems & Comparing Evidence
Learning goals
- I can explain sampling ecosystems & comparing evidence.
- I can use evidence, a model, and stated assumptions to support a biological explanation.
Before this unit
Use the supplied vocabulary, distinguish an observation from an explanation, and identify any units or model assumptions. Revisit a connected earlier unit if needed; new terms are explained here.
Use three flexible 40–45-minute sessions: core background and Parts 1–2 with their checks; Parts 3–4 and the worked application; then remaining practice, a labeled model, revision, and the exit check. Checks completed during reading can count toward the practice set. Read one short part at a time. Investigations and chapter review/quiz have separate sessions, and flexible weeks allow more time.
Nobody counts all the daisies in a field. For almost any ecological question, counting everything is impossible, so ecologists count part of it and scale up. A sample is the part counted, and everything downstream depends on whether it represents the whole. That makes sampling a method with a built-in risk, and the risk has a name: sampling bias is any way the sample systematically differs from the thing it is meant to represent.
Two tools cover most situations. A quadrat is a frame of known area, usually a square, placed on the ground so that everything inside it can be counted. Several quadrats give a count per unit area, which can be scaled to the whole habitat. A transect is a line across an area along which samples are taken at intervals, and it is the tool for a question about change across a gradient — up a shore, out from a path, down a hillside — where an average over the whole area would hide exactly what you want to see.
What a quadrat gives you is density: individuals per unit area. Count several quadrats, average the counts, divide by the quadrat area, and multiply by the habitat area to estimate the total. The arithmetic is easy, and the result is an estimate whose quality depends entirely on decisions made before any counting happened — above all on where the quadrats went. Choosing attractive-looking spots produces a number that is precise, reproducible and wrong, which is why placement is decided in advance and at random.
Build your understanding
Where this fits
Every population figure and diversity measure in the last two chapters came from somewhere, and almost none of them came from counting everything. This unit is how those numbers are actually produced, what makes an estimate trustworthy, and the one decision — where to put the plots — that quietly determines the answer.
Use three flexible 40–45-minute sessions: core background and Parts 1–2 with their checks; Parts 3–4 and the worked application; then remaining practice, a labeled model, revision, and the exit check. Checks completed during reading can count toward the practice set. Read one short part at a time. Investigations and chapter review/quiz have separate sessions, and flexible weeks allow more time.
Part 1 · Matching the tool to the question
A quadrat answers questions about how much of something there is across an area: how dense a plant is, how cover differs between two fields, whether a species is more abundant here than there. The counts from scattered quadrats are averaged, and the scatter between them also tells you how variable the area is.
A transect answers questions about change along a direction. Vegetation up a beach, species composition outward from a path, plants along a gradient from wet to dry — in each case the pattern is the finding, and averaging over the whole area would destroy it. Samples are taken at stated intervals along the line, and the result is plotted against distance.
Choosing the wrong tool wastes the work. Averaging quadrats thrown across a shore gives a single meaningless figure for a place where everything depends on height up the beach. Running a transect across a uniform field produces a flat line that a handful of quadrats would have established faster. The question comes first and the tool follows from it.
Pause and explain
You want to know how plant species change as you move away from a footpath. Quadrats scattered at random, or a transect?
Check your reasoning after answering
A transect, because the question is about change along a direction. Samples taken at intervals on a line running away from the path show how composition shifts with distance, which is the finding. Quadrats scattered at random would be averaged into a single figure for the area and would hide the pattern entirely.
Part 2 · Deciding where to sample before you look
Placement is where bias enters, and it usually enters innocently. Put quadrats where the ground looks interesting and you oversample what caught your eye. Put them near the path because it is easier and you sample trampled ground. Avoid the nettles and you systematically exclude whatever grows with nettles. None of these requires any intention to mislead.
The defence is to decide placement before examining the area, and to use a procedure rather than a judgement. Random coordinates generated beforehand, or a systematic grid laid out regardless of what is in each cell, both remove the choice from the moment of looking. Write the procedure down before starting, and follow it even when a quadrat lands somewhere unpromising — especially then, since the unpromising spots are exactly what a biased sample leaves out.
Sample size matters alongside placement. Four quadrats in a variable area give an average that could easily be a long way from the truth, and the scatter between them is the clue: if four counts are 2, 4, 3 and 3 the area is fairly uniform, and if they are 0, 11, 1 and 0 the average of three means very little. Report the individual counts, not only the mean, which is the point the data unit in Chapter 1 made.
Pause and explain
Why should quadrat positions be decided before looking at the area?
Check your reasoning after answering
Because choosing positions while looking introduces bias without any intention to mislead — attractive patches get oversampled, difficult ground gets avoided, and convenient spots near a path are not typical. A procedure fixed in advance, such as random coordinates or a systematic grid, removes the choice from the moment of looking and makes the sample defensible.
Part 3 · Calculating density and scaling up
The calculation has three steps and each should be written out. Add the counts and divide by the number of quadrats to get a mean count per quadrat. Divide by the quadrat area to get density per unit area. Multiply by the habitat area to get an estimated total.
Work the model. Four quadrats of 1 m² contain 2, 4, 3 and 3 plants. The total is 12 across 4 m², so the density is 12 ÷ 4 = 3 plants per square metre. The habitat is 20 m², so the estimated total is 3 × 20 = 60 plants.
Then look at the scatter before trusting it. The four counts range from 2 to 4, a spread of 2 around a mean of 3, which suggests a reasonably uniform distribution and makes the estimate of 60 plausible. Had the counts been 0, 0, 1 and 11, the same mean of 3 would have come from a clumped distribution, and an estimate of 60 would depend entirely on how many clumps the 20 m² happened to contain.
Pause and explain
Four 1 m² quadrats contain 2, 4, 3 and 3 plants, and the habitat is 20 m². Calculate the density and the estimated total.
Check your reasoning after answering
The total is 12 plants in 4 m², so the density is 12 ÷ 4 = 3 plants per square metre. Multiplying by the habitat area gives 3 × 20 = 60 plants as the estimate. The counts range only from 2 to 4, which suggests a fairly even distribution and makes the scaling more trustworthy than it would be for a clumped one.
Part 4 · Saying that it is an estimate, and what it assumes
Sixty is an estimate and should be written as one. It assumes the four quadrats represent the whole 20 m², that the counting detected every individual present within them, that the species was correctly identified, and that the habitat area is what was stated. Each assumption can fail, and naming them is what distinguishes a scientific figure from a guess with arithmetic attached.
Detection is the assumption most often forgotten. Small, hidden or partly buried individuals are missed, and if they are missed consistently the estimate is biased low in a way more sampling will not fix — repeating a method that misses things simply produces the same error more precisely. Only a change of method addresses it.
So report the figure with its workings and its limits: four 1 m² quadrats placed at random coordinates fixed in advance, counts of 2, 4, 3 and 3, mean density 3 per square metre, estimated total 60 individuals in 20 m², assuming the quadrats represent the area and that detection was complete. That sentence is checkable, reusable and honest, and it is the standard this chapter has been working towards.
Pause and explain
Why does taking more quadrats not fix a detection problem?
Check your reasoning after answering
Because a method that consistently misses small or hidden individuals makes the same error in every quadrat. More sampling reduces the random scatter around the figure but not the systematic shortfall, so the estimate becomes more precise and remains biased low. Only changing the method — closer searching, a different technique — addresses it.
Apply the whole unit · Estimate a plant density
Illustrative sample, not surveyed data: four quadrats of 1 m² contain 2, 4, 3 and 3 plants of one species. The habitat area is 20 m².
Your task
Find the sample density, calculate an extrapolated total, and state the assumptions that prevent it being called a complete census.
What your response should show
- Explain the relevant biological process accurately.
- Use the supplied evidence and show calculation steps with units where needed.
- Connect a labeled model or mechanism with the claim.
- State an assumption, evidence limitation, or useful next observation.
Response guidance — after your attempt
Total the counts: 2 + 4 + 3 + 3 = 12 plants across 4 m² of quadrats.
Calculate density: 12 ÷ 4 = 3 plants per square metre.
Scale to the habitat: 3 × 20 = 60 plants as the estimated total.
Name the assumptions: that the quadrats represent the whole area, that every individual present in them was detected, that the species was identified correctly, and that the habitat is 20 m² as stated.
The sample density is 3 plants per square metre and the extrapolated total is 60 plants. The four quadrats contain 2 + 4 + 3 + 3 = 12 plants across 4 m², giving 12 ÷ 4 = 3 per square metre, and multiplying by the 20 m² habitat gives 3 × 20 = 60. The word estimate matters and should appear in any report of it, because four assumptions stand between the calculation and a count. First, that the four quadrats represent the whole area — which depends on how they were placed, and the figure is only defensible if positions were fixed by a procedure before the area was examined. Second, that every individual inside each quadrat was detected; small, hidden or partly buried plants are easily missed, and a method that misses them consistently biases the estimate low in a way that more quadrats will not correct. Third, that the species was identified correctly throughout, which matters where similar species grow together. Fourth, that the habitat really is 20 m² and is reasonably uniform. The scatter is reassuring here: the counts run from 2 to 4 around a mean of 3, which suggests a fairly even distribution and makes scaling reasonable. Counts of 0, 0, 1 and 11 would have given the same mean and a very different situation, where the total would depend on how many clumps the area happened to hold. Reported properly: four 1 m² quadrats at predetermined random positions, counts 2, 4, 3, 3, density 3 per m², estimated total 60 individuals in 20 m², assuming representative placement and complete detection.
Scientific references for this unit
Parent / teacher teaching notes
Ask for a because-statement and a labeled relationship, not just a memorized word. Work through one calculation step at a time, permit oral or diagram responses, and use flexible sessions for difficult reading. Compare the learner’s actual evidence with the supplied model; do not reward copying or agreement with a personal preference. No private family, genetic, or medical records are required.
The key idea
Ecologists often sample because counting every organism across a large habitat is impractical. A quadrat defines an area for selected observations; a transect organizes observations along a line. The method must fit the organism and question. A plant-count method does not automatically detect moving animals equally well.
Worked examples
Example 1 · Judge an estimate from its scatter
- Survey X: total 20 in 5 m², density 4 per m², estimate 4 × 50 = 200.
- Survey Y: total 20 in 5 m², density 4 per m², estimate 4 × 50 = 200 — the identical figure.
- Compare the scatter: X ranges from 2 to 5, while Y is four zeros and a 20, which indicates a strongly clumped distribution.
Identical means can come from completely different distributions. Always look at the individual counts.
Example 2 · Find the bias in a procedure
- Identify the decision rule actually used: positions chosen while looking, selected for apparent variety.
- Predict the direction of the error: the richest patches are oversampled, so richness and diversity will come out higher than the meadow's average.
- Replace judgement with procedure: generate random coordinates before entering, or lay a systematic grid, and sample every position the procedure gives.
Ask what decided each position. If the answer involves looking first, the sample is biased.
Avoid these mistakes
- Mistake: an extrapolated total is a count. Four quadrats giving 60 plants in 20 m² is an estimate assuming representative placement and complete detection; say so.
- Mistake: quadrats can be placed where the ground looks interesting. That oversamples what caught your eye; positions must be fixed by a procedure before the area is examined.
- Mistake: more quadrats fix any problem. More sampling reduces random scatter but not a systematic shortfall from missing hidden individuals — that needs a different method.
- Mistake: the mean is the result. Counts of 2,4,3,3 and 0,0,1,11 give the same mean and completely different confidence in scaling it up.
Check your understanding
Why specify whether sightings or individuals are counted?
Discuss the answer
Repeated sightings can involve one individual; the quantities answer different questions.
Can a mean remove biased site selection?
Discuss the answer
No. A biased set can still produce a precise-looking mean; location selection must be addressed.
Words to know
- sample
- The part of an area actually counted, from which the whole is estimated; everything depends on whether it represents the whole.
- quadrat
- A frame of known area placed on the ground so everything inside can be counted, giving a density that can be scaled up.
- transect
- A line across an area with samples taken at intervals, used when the question is about change along a gradient rather than an average.
- density
- Individuals per unit area; mean count per quadrat divided by quadrat area, then multiplied by habitat area to estimate a total.
- sampling bias
- Any systematic difference between the sample and the whole, usually introduced by choosing where to sample while looking at the area.
Extend your scientific explanation
Compare a second supplied example or the linked educational reference. Identify a connection, a model limit, and an additional observation that would test the explanation.
In the real world
Use a clear question, reliable observations, and a biological mechanism to evaluate a claim. State what remains uncertain before applying a classroom model to a different setting.
Exit check
Does sample density establish the exact habitat total?
Check your explanation after answering
No. Extrapolation depends on sample representativeness, area definitions, and detection.
Explain your reasoning without notes. If a key idea is missing, revisit the lesson and try again.
Designing & Evaluating a Habitat Solution
Learning goals
- I can explain designing & evaluating a habitat solution.
- I can use evidence, a model, and stated assumptions to support a biological explanation.
Before this unit
Use the supplied vocabulary, distinguish an observation from an explanation, and identify any units or model assumptions. Revisit a connected earlier unit if needed; new terms are explained here.
Use three flexible 40–45-minute sessions: core background and Parts 1–2 with their checks; Parts 3–4 and the worked application; then remaining practice, a labeled model, revision, and the exit check. Checks completed during reading can count toward the practice set. Read one short part at a time. Investigations and chapter review/quiz have separate sessions, and flexible weeks allow more time.
An ecological decision almost never has a correct answer waiting to be discovered. It has options, each doing some things well and costing something, and a choice that depends on what you are trying to achieve. The discipline that makes such a choice defensible is simple to state: write down what counts as success and what you are limited by, before looking at the options.
A criterion is a statement of what the solution must achieve, expressed so that it can be measured — reduce runoff from this area by at least half during a rainfall event of this size. A constraint is a limit you must work within: a budget, an area of available land, a rule about what can be built, a requirement that a space stay usable. Criteria say what good looks like; constraints say what is allowed. Both have to be written before options are compared, or the criteria quietly become a description of whichever option was already preferred.
Then comes building and testing. A prototype is a first version made to be tested rather than to be final — a single planted strip rather than a whole site, a model basin, a trial on one corner. Iteration is the cycle of testing it, learning something, and changing it, and a design that has not been through at least one iteration has not been tested. Cost effectiveness is the comparison that stops a decision being made on total performance alone: how much benefit each unit of cost buys, which can rank options differently from raw effect and is the reason both figures should be calculated.
Build your understanding
Where this fits
This chapter has covered what interacts with what, what makes a community resilient, how human activity changes habitats, and how the evidence is actually gathered. The last unit puts them to work on a decision — which is where ecology usually ends up — and closes the chapter with the method for comparing options honestly.
Use three flexible 40–45-minute sessions: core background and Parts 1–2 with their checks; Parts 3–4 and the worked application; then remaining practice, a labeled model, revision, and the exit check. Checks completed during reading can count toward the practice set. Read one short part at a time. Investigations and chapter review/quiz have separate sessions, and flexible weeks allow more time.
Part 1 · Writing a problem down so it can be solved
A vague problem produces an unevaluable solution. "Improve the schoolyard for wildlife" cannot be succeeded at or failed at. A written version names what will change, by how much, measured how, by when, and within what limits — which is the same discipline as turning a broad question into a testable one in Chapter 1.
Criteria should be measurable with the means available. If you cannot measure invertebrate abundance, do not make it the criterion; choose something you can measure, such as area of flowering plants or number of structures provided, and say plainly that it stands in for the thing you care about. A measurable proxy honestly labelled beats an unmeasurable ideal.
Constraints are easy to leave implicit and expensive to discover late. Budget, space, who maintains it and how often, what the area is also used for, what is allowed. A design that meets every criterion and violates a constraint is not a solution, and finding that out after building it is the common failure.
Pause and explain
Turn "make the yard better for wildlife" into a statement with a criterion and a constraint.
Check your reasoning after answering
Something like: increase the area of flowering plants in the yard from 0 to at least 20 m² by June, within a budget of £100 and without reducing the usable play area. The criterion names a measurable target with a deadline; the constraints name the budget and the competing use. Both are written before options are compared.
Part 2 · Comparing options on the same evidence
Options must be assessed against the same criteria using comparable evidence. If one option's performance is a measurement and another's is a manufacturer's claim, the comparison is not between the options but between two kinds of statement. Where evidence differs in quality, say so, and treat the weaker figure with more doubt rather than averaging them as equals.
Set the comparison out as a table: each option against each criterion and constraint, with the figures. A table makes the trade-offs visible and prevents the common move of comparing option A on its best criterion with option B on its worst.
Work the model. Within a budget of 100 tokens, plan A costs 80 and reduces runoff from 20 to 8 L; plan B costs 60 and reduces it from 20 to 10 L. Both meet the same stated space requirement. A reduces runoff by 12 L and B by 10 L, so A performs better in total — and both fit the budget, so the constraint does not decide it.
Pause and explain
Plan A costs 80 and takes runoff from 20 to 8 L; plan B costs 60 and takes it from 20 to 10 L. Which reduces runoff more?
Check your reasoning after answering
Plan A. It reduces runoff by 20 − 8 = 12 L, while plan B reduces it by 20 − 10 = 10 L, so A achieves 2 L more reduction. Both fit a 100-token budget, so affordability does not separate them — which is exactly when a second comparison, such as reduction per token spent, becomes worth calculating.
Part 3 · Cost effectiveness, and the downside you have to name
Total performance is one comparison and benefit per unit cost is another, and they can disagree. Divide each plan's reduction by its cost. Plan A gives 12 ÷ 80 = 0.15 litres reduced per token. Plan B gives 10 ÷ 60 = 0.167 litres per token. So A achieves more overall and B achieves slightly more for each token spent.
Neither figure settles it, and recognising that is the point. If the goal is the largest reduction available within the budget, A wins. If the goal is efficient use of funds, or if the remaining 40 tokens could be spent on something else worthwhile, B has a claim. The decision follows from which criterion was stated as primary, which is why that had to be written down first.
Every option also has a downside, and naming it is part of the proposal rather than an argument against it. A costs most of the budget, leaving little for anything else or for repair. B leaves 40 tokens and achieves less. Both need maintenance that the model says is unknown, which is a real gap: a plan that performs well and is never maintained can end up worse than a modest one that is.
Pause and explain
Calculate the reduction per token for both plans, and say what the comparison shows.
Check your reasoning after answering
Plan A gives 12 L ÷ 80 = 0.15 litres per token; plan B gives 10 L ÷ 60 = 0.167 litres per token. B is slightly more cost effective while A delivers the larger total reduction. The two measures disagree, so the choice depends on which criterion was stated as primary — maximum reduction within budget, or best value per token.
Part 4 · Proposing a next test rather than a verdict
A recommendation is stronger when it includes the test that would confirm or overturn it. "Build plan B on the eastern corner first, measure runoff over the next three rainfall events against the untreated western corner, and extend it if the reduction holds" commits to a decision and keeps it revisable, which is what a prototype is for.
The test should target the biggest uncertainty rather than the easiest measurement. Here the model says maintenance is unknown, so a trial running long enough to need maintenance is worth more than one that measures peak performance in week one. The weakest part of the evidence is where the next effort should go.
That is the end of this chapter and most of the method of the course. Define the problem measurably, state the criteria and constraints before looking, compare options on the same evidence, calculate more than one measure, name the trade-off and the downside, choose under a stated criterion, and say what would change your mind. It applies to a schoolyard and it applies to a national decision, and the difference is scale rather than kind.
Pause and explain
Why should a recommendation include a next test, and what should the test target?
Check your reasoning after answering
Because a recommendation based on model figures is a decision under uncertainty, and a test makes it revisable rather than final. The test should target the biggest uncertainty rather than the easiest measurement — here, maintenance is unknown, so a trial long enough to need maintenance is worth more than one measuring peak performance immediately after installation.
Apply the whole unit · Recommend a model habitat plan
Illustrative plans within a 100-token budget, not real costings: plan A costs 80 and reduces runoff from 20 to 8 L; plan B costs 60 and reduces it from 20 to 10 L. Both satisfy the same stated space requirement, and later maintenance needs are unknown for both.
Your task
Calculate each plan's reduction and its reduction per token, recommend one under an explicitly stated criterion, and give a next test.
What your response should show
- Explain the relevant biological process accurately.
- Use the supplied evidence and show calculation steps with units where needed.
- Connect a labeled model or mechanism with the claim.
- State an assumption, evidence limitation, or useful next observation.
Response guidance — after your attempt
Calculate the reductions: A gives 20 − 8 = 12 L; B gives 20 − 10 = 10 L.
Calculate reduction per token: A gives 12 ÷ 80 = 0.15 L per token; B gives 10 ÷ 60 = 0.167 L per token.
State the criterion before recommending, since the two measures disagree — maximum total reduction favours A, best value per token favours B.
Propose a next test aimed at the largest unknown, which the model says is maintenance.
Plan A reduces runoff by 20 − 8 = 12 L and plan B by 20 − 10 = 10 L, so A achieves 2 L more in total. On cost effectiveness the ranking reverses: A delivers 12 ÷ 80 = 0.15 litres of reduction per token and B delivers 10 ÷ 60 = 0.167 litres per token, so B buys slightly more for each token spent. Both fit the 100-token budget and both meet the stated space requirement, so neither constraint decides it, and the two performance measures point different ways — which is exactly why the criterion has to be stated rather than discovered. Under a criterion of maximum runoff reduction within the budget, plan A is the recommendation. Under a criterion of best value per token, or where the remaining 40 tokens have another worthwhile use such as maintenance or a second site, plan B is. I would recommend B under a stated criterion of value per token plus reserve for upkeep, precisely because the model says maintenance needs are unknown for both, and a plan that consumes 80 of 100 tokens leaves almost nothing to repair or adjust it. Each option's downside should be named: A leaves little budget for anything else, and B accepts 2 L less reduction. The next test should target that largest unknown rather than the easiest measurement. Build plan B on one section, leave a comparable section untreated, measure runoff from both over several rainfall events across at least one season — long enough for maintenance needs to appear — and extend, revise or switch to A depending on whether the reduction holds up once the installation is no longer new.
Scientific references for this unit
Parent / teacher teaching notes
Ask for a because-statement and a labeled relationship, not just a memorized word. Work through one calculation step at a time, permit oral or diagram responses, and use flexible sessions for difficult reading. Compare the learner’s actual evidence with the supplied model; do not reward copying or agreement with a personal preference. No private family, genetic, or medical records are required.
The key idea
Engineering begins with a defined problem, criteria for success, and constraints such as available space, resources, time, and safety. An ecological proposal should connect a mechanism with measurements. “Help nature” is too broad unless we define which conditions or functions are being improved.
Worked examples
Example 1 · Make an unevaluable goal evaluable
- Name a measurable outcome within reach: area of flowering plants in bloom, or number of nesting structures installed, as a stated proxy for pollinator support.
- Attach a target and a date so success or failure is decidable.
- Name the constraints: budget, available area, who maintains it, and any competing use of the space.
A measurable proxy, labelled as one, beats an unmeasurable ideal.
Example 2 · Decide when two measures disagree
- Compare totals: P removes 30 kg against Q's 18 kg, so P does more.
- Compare value: P gives 30 ÷ 200 = 0.15 kg per token; Q gives 18 ÷ 90 = 0.2 kg per token, so Q buys more per token.
- Recognise that the question is unanswerable as asked, because better depends on which criterion was stated.
When totals and value per cost disagree, the criterion decides. Name it before calculating.
Avoid these mistakes
- Mistake: criteria can be settled after seeing the options. Then they describe the preferred option rather than testing it; write them before comparing.
- Mistake: the option with the biggest effect wins. A reduces 12 L against B's 10, and B gives 0.167 L per token against A's 0.15 — the measures disagree and the stated criterion decides.
- Mistake: naming a downside weakens a proposal. An unnamed downside is discovered later by someone else; naming it is what makes the recommendation trustworthy.
- Mistake: a recommendation ends the work. A prototype and a next test aimed at the biggest unknown — here maintenance — is what makes a decision revisable.
Check your understanding
How is a criterion different from a constraint?
Discuss the answer
A criterion evaluates success; a constraint limits allowable options, such as a maximum budget or available area.
Why not compare one design’s best trial with another’s worst?
Discuss the answer
It selects evidence unfairly and can misrepresent typical performance; compare the full relevant records.
Words to know
- criterion
- A measurable statement of what a solution must achieve, written before options are compared so it cannot be shaped to fit a favourite.
- constraint
- A limit the solution must work within — budget, space, maintenance, competing uses; a design that violates one is not a solution.
- prototype
- A first version built to be tested rather than to be final, such as one planted section instead of a whole site.
- iteration
- The cycle of testing, learning and changing; a design that has not been through one has not been tested.
- cost effectiveness
- Benefit per unit of cost, which can rank options differently from total benefit — 0.15 against 0.167 litres per token here.
Extend your scientific explanation
Compare a second supplied example or the linked educational reference. Identify a connection, a model limit, and an additional observation that would test the explanation.
In the real world
Use a clear question, reliable observations, and a biological mechanism to evaluate a claim. State what remains uncertain before applying a classroom model to a different setting.
Exit check
What makes a proposed revision useful?
Check your explanation after answering
It targets an identified limitation or tradeoff and can be evaluated with a defined measurement.
Explain your reasoning without notes. If a key idea is missing, revisit the lesson and try again.
Problem 1
Answer and explanation
Herbivory could reduce cover, while drought could also limit plant growth. The two recorded changes do not isolate either cause. Compare feeding observations, water conditions, and suitable reference plots across repeated intervals. Plant cover and counts are different measures, and the model should not claim a single cause from their association alone.
Cover falls 30 percentage points.
Herbivore count doubles.
Compare feeding effects with drought and a suitable matched observation.
Response criteria
- Explain the relevant biological process accurately.
- Use the supplied evidence and show calculation steps with units where needed.
- Connect a labeled model or mechanism with the claim.
- State an assumption, evidence limitation, or useful next observation.
Problem 2
Answer and explanation
No. Resource overlap and limitation, or effects on performance, need evidence.
Problem 3
Answer and explanation
The samples have equal richness and total count but different distributions. B is more even under the stated observations. These facts do not establish every functional relationship, genetic diversity, or response to future disturbances. Comparable repeated surveys and role-specific evidence would improve a resilience argument.
Richness is three in each.
Total abundance is ten in each.
A is more dominated by one species; B is more evenly distributed.
Response criteria
- Explain the relevant biological process accurately.
- Use the supplied evidence and show calculation steps with units where needed.
- Connect a labeled model or mechanism with the claim.
- State an assumption, evidence limitation, or useful next observation.
Problem 4
Answer and explanation
Yes. Individuals may belong to different numbers of species.
Problem 5
Answer and explanation
B has 8 L less recorded runoff in this illustrative trial. Vegetation-associated retention or infiltration could contribute under the stated comparison. The record does not establish all causal details, repeated performance, or absence of contaminants. More matched trials and separate water-quality measures are needed for stronger claims.
Difference: 18−10=8 L.
Connect vegetation and soil with possible infiltration or retention.
Separate runoff amount from all water-quality properties and identify the single-trial limit.
Response criteria
- Explain the relevant biological process accurately.
- Use the supplied evidence and show calculation steps with units where needed.
- Connect a labeled model or mechanism with the claim.
- State an assumption, evidence limitation, or useful next observation.
Problem 6
Answer and explanation
Actual effects depend on movement, species needs, alternative routes, and observations not given by the line alone.
Problem 7
Answer and explanation
The sample density is 3 plants/m² and the extrapolated count is 60 plants. It is an estimate assuming the plots represent the 20 m² habitat and detection is adequate. Patchiness, omitted zones, or missed plants could change the result. The supplied data do not establish an exact total.
Total count: 12 across 4 m².
Density: 12/4=3 plants/m².
Estimated larger count: 3×20=60.
Response criteria
- Explain the relevant biological process accurately.
- Use the supplied evidence and show calculation steps with units where needed.
- Connect a labeled model or mechanism with the claim.
- State an assumption, evidence limitation, or useful next observation.
Problem 8
Answer and explanation
Repeated sightings can involve one individual; the quantities answer different questions.
Problem 9
Answer and explanation
A provides the larger total reduction in the model, while B gives a slightly larger reduction per token. Both fit the initial budget. Either can be supported under an explicit priority, but maintenance, repeated performance, and real-setting transfer remain unknown. Recommend a matched repeated test and a maintenance estimate; fictional tokens are not actual prices.
A reduction: 12 L; B: 10 L.
A ratio: 12/80=0.15 L/token; B: 10/60≈0.167 L/token.
Choose using total reduction or cost efficiency and identify maintenance uncertainty.
Response criteria
- Explain the relevant biological process accurately.
- Use the supplied evidence and show calculation steps with units where needed.
- Connect a labeled model or mechanism with the claim.
- State an assumption, evidence limitation, or useful next observation.
Problem 10
Answer and explanation
A criterion evaluates success; a constraint limits allowable options, such as a maximum budget or available area.