Earth’s Interior & Plate Tectonics — Print · Earth & Space Science, Grade 9
Connect Earth’s interior, moving plates, crustal evidence, and natural hazards.
Printable chapter lessons and review.
Earth's Internal Structure
Learning goals
- I can describe Earth's layers by composition — crust, mantle, outer core, and inner core.
- I can describe Earth's layers by physical property — lithosphere, asthenosphere, and mesosphere.
- I can explain how heat drives the convection currents that move Earth's plates.
Readings for this unit
Before this unit
Distinguish temperature, density and physical state.
Plan three teaching sessions: core explanation and Parts 1–2; Parts 3–4 with diagrams and reasoning checks; then the whole-unit application, worked examples, independent practice, and exit check. Read one part at a time, explain it without notes, and revisit any gap. Allow about 40–50 minutes per session; adjust after checking understanding. Trace and explain the labeled figures in each part. In the third session, complete the illustrated case and changed independent application; retain a corrected explanation rather than only an answer.
Start with something to explain
How can solid rock move while a plate stays rigid?
Illustrative evidence case. Earthquake wave patterns constrain an outer-core region through which compression waves propagate but direct shear waves do not. Near the surface, plates include crust and uppermost mantle.
Notice and wonder
Record two observations using the stated quantities or relationships. Keep observations separate from possible causes. Write one question that a new measurement could help answer.
How can solid rock move while a plate stays rigid?
Your first model
Draw separate composition and mechanical-behavior labels; state what wave evidence and long-term shape changes might reveal.
Build the language from the idea
- crust
- Earth's thin, rocky outer layer — oceanic crust (about 5–10 km thick, basalt) under the oceans, and thicker continental crust (about 30–50 km thick, granite) under land.
- mantle
- The thick, mostly solid layer of hot silicate rock between the crust and the core, about 2,900 km deep, that flows extremely slowly over millions of years.
- lithosphere
- Earth's rigid outer shell — the crust plus the very topmost mantle — broken into the tectonic plates.
- asthenosphere
- The soft, slowly-flowing mantle layer beneath the lithosphere that the tectonic plates slide on.
- P wave
- A compression/expansion seismic wave that can propagate through suitable solids and liquids.
- S wave
- A seismic shear wave; liquids do not sustain its restoring shear behavior.
Crack open the Earth like a hard-boiled egg and you'd find distinct layers stacked from the surface all the way down to the center. They're arranged that way for a reason. When our planet was young, about 4.6 billion years ago, it was so hot that much of it was molten, and the heaviest materials — iron and nickel — sank toward the middle while lighter, rocky material floated toward the top, sorting Earth into layers by density the way oil and water separate in a jar. The thin outer skin left on top is the crust — so thin compared with the whole planet that, on a scale model of Earth, it would be thinner than the skin of an apple. Ocean-floor crust is only about 5–10 km thick and made of dense, dark basalt, while the continental crust under your feet is thicker (30–50 km) and made of lighter granite, which is exactly why the continents ride higher than the ocean basins do.
Below the crust sits the mantle, an enormous shell of solid silicate rock almost 2,900 km thick and rich in iron and magnesium — by itself it makes up the largest share of Earth's volume. It's solid, yet over millions of years it flows extremely slowly, more like warm asphalt or thick modeling clay than anything you'd normally call a liquid. Deeper still is the outer core, a roughly 2,200 km thick layer of liquid iron and nickel so hot it churns like a metallic ocean. That churning does something remarkable: as the electrically charged liquid metal swirls, it generates Earth's magnetic field — the invisible shield that deflects harmful particles streaming from the Sun and helps keep our atmosphere from being blown away into space. At the very center is the inner core, a solid ball of iron and nickel with a radius of about 1,220 km. Here's the surprise: it is actually hotter than the outer core, but the crushing pressure at Earth's center squeezes its atoms together so tightly that the iron simply cannot flow, forcing it to stay solid.
Geologists also slice Earth a second way — grouped by how the rock behaves rather than by what it's made of. The rigid, brittle outer shell (the crust plus the very top of the mantle) is called the lithosphere, and it is the layer broken into the giant moving slabs we call tectonic plates. Right beneath it lies the asthenosphere, a hotter, softer band of the mantle that acts like warm modeling clay: firm enough to hold together if you poke it quickly, but soft enough to ooze and deform slowly over millions of years.
This is where a very common misconception sneaks in, so it's worth stopping on: the plates are *not* floating on a hidden sea of liquid magma. The asthenosphere is still solid rock — it just flows, the same way a glacier is solid ice yet still creeps downhill. Because the rigid lithosphere rides and slides on top of this slow-flowing layer, the asthenosphere is what makes plate motion possible in the first place. Below the asthenosphere, the stiffer lower mantle is sometimes called the mesosphere, and beneath that sit the same liquid outer core and solid inner core.
So what keeps all of this moving? Heat, and its restless journey toward the surface. Earth still holds leftover heat from its violent formation, and it constantly makes fresh heat as radioactive elements buried inside slowly decay. That heat drives slow convection currents in the mantle: hot rock near the core becomes slightly less dense and rises, cools as it nears the lithosphere, then sinks back down to be reheated — over and over, like an incredibly slow-motion pot of soup simmering on a stove, or a lava lamp whose warm blobs rise while cooler ones sink in an endless loop. This churning mantle is the engine of the whole planet's surface: it drags the plates around, and with them come the earthquakes, volcanoes, mountains, and drifting continents you'll meet in the rest of this unit.
The crust, mantle and core describe layers by composition. Lithosphere and asthenosphere describe mechanical behavior. These sets of names overlap but are not identical: the lithosphere includes crust and the rigid uppermost mantle.
Much of the mantle is solid rock that can flow very slowly over long times. A region need not be liquid to deform. The outer core is liquid and the inner core solid because pressure as well as temperature affects state.
Earth's interior is inferred from evidence such as seismic-wave travel, density and magnetic behavior rather than direct drilling to the center. A cross-section is a model with an exaggerated crust unless drawn to scale. Explain how the evidence supports the layer model and where uncertainty remains.
Build your understanding
Plan three teaching sessions: core explanation and Parts 1–2; Parts 3–4 with diagrams and reasoning checks; then the whole-unit application, worked examples, independent practice, and exit check. Read one part at a time, explain it without notes, and revisit any gap. Allow about 40–50 minutes per session; adjust after checking understanding.
Part 1 · Two ways to classify Earth’s layers
A compositional layer groups materials by what they are made of. A mechanical layer groups them by how they respond to stress. The mantle begins below the crust, yet its cool uppermost portion can be rigid enough to belong to a tectonic plate. That rigid crust-plus-uppermost-mantle layer is the lithosphere. Beneath it, the hotter asthenosphere can deform more readily over long times. Do not put crust, lithosphere and mantle into one mutually exclusive list: their boundaries answer different questions.
Read the visual model
Compare the left composition model with the right close-up. Follow the bracket across both crust and uppermost mantle. The close-up is not to the same scale as the whole-Earth view.
Why does identifying a sample as mantle rock not establish whether it belongs to the lithosphere?
Visual reasoning — after your attempt
Mantle describes composition. The sample could be in rigid uppermost mantle within the lithosphere or deeper deformable mantle; its depth, temperature and mechanical setting matter.
Composition and mechanical behavior answer different questions. Crust, mantle and core distinguish material composition. Lithosphere, asthenosphere, outer core and inner core describe mechanical or physical properties. The lithosphere includes crust and uppermost mantle; it is not another name for the crust.
Continental crust is generally thicker and less dense than oceanic crust. Both are parts of rigid plates with underlying mantle material. Draw both classifications beside one radius so their boundaries are not falsely equated.
Pause and explain
Why does a plate contain more than crust?
Check your reasoning after answering
A lithospheric plate includes crust and the rigid uppermost mantle beneath it.
Part 2 · Infer the interior from wave behavior
A P wave alternately compresses and expands material along its travel direction. A shear, or S, wave changes shape sideways relative to its travel direction. A liquid cannot sustain the restoring shear behavior needed for an S wave, although compression waves can travel through it. Earth’s liquid outer core therefore interrupts direct S-wave transmission. P-wave paths can bend when wave speed changes between layers; the lack of an arrival at one station also depends on source, path, instrument and detection threshold. A global pattern gives stronger evidence than one silent sensor.
Read the visual model
Read the panels as material tests, not a map of seismic rays. Alternating dense/spread markers model compression in both materials. The shear curve appears only in the solid panel; the arrows show P-wave travel, not a permanent particle flow.
Could a missing S-wave arrival alone prove that all material beneath that one station is liquid?
Visual reasoning — after your attempt
No. Combine many stations and P/S travel-time patterns, check instrument and source conditions, and evaluate the paths. A missing arrival can have more than one explanation.
Earthquake waves provide indirect evidence. P waves can travel through solids and liquids, while S waves cannot propagate through a liquid as shear waves. Changes in speed and direction, plus shadow regions, constrain boundaries and material properties. Multiple observations are needed to interpret a layer, not one missing arrival alone.
The global absence of direct S waves through the outer core, combined with P-wave behavior, supports a liquid outer core. It does not mean the whole interior is liquid or that temperature is measured directly by a seismograph.
Pause and explain
Why is a missing S-wave arrival at one station insufficient by itself?
Check your reasoning after answering
Source direction, instrument performance and paths can affect an arrival; a global pattern and other evidence constrain the interior.
Part 3 · Solid material can deform over long times
Deformation is a change in shape. At very high temperatures below their melting conditions, crystals can change shape and move relative to neighboring crystals over extremely long intervals. A material that resists an ordinary short push can therefore flow slowly under persistent stress. This is why the mostly solid mantle can participate in convection. Partial melting is different: only a portion of material becomes melt under suitable conditions, and that melt may separate. Avoid replacing these distinct processes with the phrase liquid mantle.
Read the visual model
Compare arrangements across the two schematic snapshots. The particles are crystal-scale markers for deformation, not actual mantle atoms or a literal time-lapse measurement.
What extra information would distinguish slow solid deformation from actual melting in a rock model?
Visual reasoning — after your attempt
Temperature, pressure, composition and evidence of a liquid phase or melt textures help distinguish them. Shape change alone can occur in a solid and does not establish melting.
Most of the mantle is solid. At high temperature and pressure, rock can deform slowly over geological times without becoming a global magma ocean. The outer core is liquid metal; the inner core remains solid under extreme pressure. State, composition, and deformation rate are separate properties.
A material may seem rigid during a short test yet flow over very long intervals. That analogy helps with time scale, but it does not make mantle rock identical to a household liquid.
Pause and explain
Does slow mantle flow imply that the mantle is mostly liquid?
Check your reasoning after answering
No. Solid rock can deform over long times under interior conditions.
Part 4 · Heat transfer and planetary change
Convection means material movement that carries energy, so it can occur in a slowly deforming solid as well as a fluid. A warmer portion may be less dense than nearby material under comparable conditions, while cold lithosphere can sink in a subduction setting. The motion and energy transfer are coupled to gravity and temperature differences. Plate forces include the sinking of cold slabs, gravitational effects associated with ridges and interactions with mantle flow. A tidy circular loop helps explain transport but is not a complete global engine with a single cell beneath every plate.
Read the visual model
Trace the arrows as a simplified circulation path. The plate is the rigid upper layer; the circulation is not proof that it simply rides a universal conveyor belt.
Why is this loop useful for heat transport but insufficient to explain every plate’s direction and speed?
Visual reasoning — after your attempt
It shows moving material carrying energy, but real flow has multiple interacting patterns and plate forces, variable properties and complex boundaries. Directions and speeds require independent measurements and a fuller force model.
Interior energy includes residual heat and radioactive decay. Conduction transfers energy through material; convection involves movement carrying energy. Cooling lithosphere, mantle flow, and density differences interact with plate motion. A simple convection sketch explains transport but does not prove that plates ride a single circular conveyor.
A surface heat measurement is local and affected by geology. Combine it with seismic, density, magnetic and laboratory evidence to constrain Earth’s interior; each method answers different parts of the problem.
Pause and explain
Why should a classroom convection picture be labeled a simplified model?
Check your reasoning after answering
It omits three-dimensional flow, different forces and changing material properties; it is not a literal map of the mantle.
Apply the whole unit · A layered-Earth explanation
Illustrative evidence set: density estimates require a dense interior; direct S waves do not cross the outer core; surface plates include crust and uppermost mantle.
Your task
Draw composition and mechanical classifications, connect each observation to an inference, and explain two limitations of the diagram.
What your response should show
- Use the supplied evidence accurately and label units or locations.
- Explain a physical mechanism or evidence-to-claim relationship.
- Show calculations or a clearly labeled model when the task calls for one.
- Identify a meaningful assumption, uncertainty, or competing explanation.
Response guidance — after your attempt
The evidence supports a dense core, liquid outer core, and rigid lithospheric plates. Distinguish crust/mantle/core from mechanical layers, label the mantle mostly solid, and state that the drawing’s sizes and motion are schematic.
Scientific references and adapted source material
Parent / teacher teaching notes
Ask for both classification systems without prompting. If the learner calls all mantle molten, use wave evidence and time-dependent solid deformation to rebuild the explanation. Ask the learner to explain each visual label and causal step before calculating. Preserve a first model, attempt the changed independent case, then use feedback to revise. Diagrams state whether values are illustrative or observed. Selected OpenSciEd excerpts are middle-school source material used for supported foundations; the independent high-school explanations and supplements are not the complete OpenSciEd teacher editions or an endorsement.
The key idea
Earth's layers are set apart by both what they're made of and how they behave, and slow, heat-driven convection in the mantle is what keeps the plates on top moving.
Worked examples
Example 1
- Divide the crust's thickness by Earth's total radius: 40 ÷ 6,371.
- 40 ÷ 6,371 ≈ 0.0063.
- Convert to a percent: 0.0063 × 100 ≈ 0.6%.
Example 2 · Worked application
- S waves do not propagate through liquids.
- Their absence along those direct paths supports a liquid outer core; other seismic observations constrain the model.
A seismic inference requires several paths and wave types.
Example 3
- List each thickness in km: crust 40, inner core 1,220, outer core 2,200, mantle 2,900.
- Since all four numbers use the same unit (km), they can be compared directly.
- Arrange from smallest to largest: 40 < 1,220 < 2,200 < 2,900.
Example 4
- Composition identifies what material is present.
- Mechanical layers describe how it responds to stress and moves over time.
Example 5 · Find and fix the mistake
- Test the claim against the stated conditions: A seismic inference requires several paths and wave types.
- Much of the mantle is solid yet can deform over long times. Plate motion does not require a global liquid mantle.
A seismic inference requires several paths and wave types.
Example 6 · Reason from the visual evidence
- Compare arrangements across the two schematic snapshots. The particles are crystal-scale markers for deformation, not actual mantle atoms or a literal time-lapse measurement.
- Temperature, pressure, composition and evidence of a liquid phase or melt textures help distinguish them. Shape change alone can occur in a solid and does not establish melting.
The panels illustrate solid-state deformation over a much longer interval. Their spacing and apparent time rate are deliberately exaggerated and have no numerical scale. They represent a mechanism, not measurements that every mantle region flows at the same speed.
Avoid these mistakes
- The mantle is not a worldwide ocean of liquid magma.
Check your understanding
Why are composition-based and behavior-based layer names both useful?
Discuss the answer
They answer different questions; crust and lithosphere therefore are not interchangeable terms.
What evidence allows scientists to infer the outer core's liquid state?
Discuss the answer
Global seismic patterns show that direct shear S waves do not propagate through the outer core while compression P waves do, with travel-time/refraction evidence constraining the boundary. Several stations, instruments and lines of evidence are needed rather than one missing arrival.
Return to the phenomenon
Return to the initial case. How can solid rock move while a plate stays rigid? Revise your drawing or explanation using two named ideas and one stated limitation.
Compare explanations after your attempt
Different classification systems overlap. Wave behavior supports a liquid outer core, while the mostly solid mantle can deform over long times; rigid lithosphere includes crust and uppermost mantle.
What should we investigate next?
Which comparison would test a remaining uncertainty? State what you would change, keep comparable and measure.
Investigate, explain and revise
Complete the tasks after studying the visual parts. Keep the first model and explain a revision before consulting the guidance.
Activity 1 · Explain the opening case
Use this unit’s opening record, Parts 1–4 and your notebook model. No external equipment or text is required for this supplied-data route.
Your task
Return to the initial case. How can solid rock move while a plate stays rigid? Revise your drawing or explanation using two named ideas and one stated limitation.
Success criteria
- Use two stated observations or conditions.
- Connect the mechanism to a labeled diagram or calculation.
- Identify what your original model missed.
- State a useful further test and a limitation.
Hint
Name the quantities and interactions before assigning a cause.
Response guidance — discuss after your attempt
Different classification systems overlap. Wave behavior supports a liquid outer core, while the mostly solid mantle can deform over long times; rigid lithosphere includes crust and uppermost mantle.
Activity 2 · Transfer to a changed case
Use the figures, captions and vocabulary in this unit; cover the worked answer.
Your task
A student labels crust, mantle and lithosphere as three separate non-overlapping compositional layers and calls slow mantle convection proof of liquid rock. Correct both statements.
Success criteria
- Use the stated measurements or conditions, with correct units.
- Connect the result to the physical mechanism or evidence relationship.
- Identify the assumption, model limit or further evidence requested.
Hint
Separate measured values, calculated results and model assumptions.
Response guidance — discuss after your attempt
Lithosphere is a mechanical layer including crust and rigid uppermost mantle, so it overlaps compositional categories. Most mantle is solid and can deform slowly under sustained stress; convection does not establish liquid state.
Words to know
- crust
- Earth's thin, rocky outer layer — oceanic crust (about 5–10 km thick, basalt) under the oceans, and thicker continental crust (about 30–50 km thick, granite) under land.
- mantle
- The thick, mostly solid layer of hot silicate rock between the crust and the core, about 2,900 km deep, that flows extremely slowly over millions of years.
- lithosphere
- Earth's rigid outer shell — the crust plus the very topmost mantle — broken into the tectonic plates.
- asthenosphere
- The soft, slowly-flowing mantle layer beneath the lithosphere that the tectonic plates slide on.
- P wave
- A compression/expansion seismic wave that can propagate through suitable solids and liquids.
- S wave
- A seismic shear wave; liquids do not sustain its restoring shear behavior.
How scientists 'see' inside Earth without digging
No drill has ever come close to reaching the mantle — the deepest hole ever bored, Russia's Kola Superdeep Borehole, only reached about 12.3 km down before the rock got too hot and soft to drill further, barely scratching the continental crust. Instead, geologists study Earth's interior the way a doctor reads an ultrasound: by tracking seismic waves from earthquakes as they speed up, slow down, bend, or vanish entirely while passing through different layers. A ring-shaped 'shadow zone' where no direct S-waves arrive on the far side of the planet was the key clue that the outer core is liquid, since S-waves cannot travel through liquid at all.
Earth's magnetic dynamo — and why it flips
The swirling, churning liquid iron and nickel of the outer core doesn't just generate heat — its motion, combined with Earth's rotation, acts like a giant electric generator called the geodynamo, producing the magnetic field that deflects harmful solar particles and makes compasses point north. That field isn't as permanent as it seems: magnetic minerals frozen into ocean-floor rock show that Earth's magnetic poles have completely flipped — north becomes south and back again — hundreds of times over the planet's history, most recently about 780,000 years ago. Scientists still aren't sure exactly what triggers a reversal, or when the next one might happen.
Two heat sources, one giant convection engine
The heat driving mantle convection comes from two different sources working together: primordial heat left over from Earth's violent formation 4.6 billion years ago (including the giant impact that may have formed the Moon), and radiogenic heat generated continuously today as radioactive isotopes of uranium, thorium, and potassium decay inside the mantle and core. Even though the mantle is technically solid rock, it flows over millions of years through a process called solid-state creep — the same reason glacier ice, which is also solid, can slowly flow downhill. Nothing is actually molten in the mantle except in rare, localized pockets.
A window into deep Earth, right in the Hudson Highlands
You don't need a spacecraft-grade drill to touch rock that once sat deep in Earth's crust — erosion has already done the digging. The ancient, heavily metamorphosed rocks of the Hudson Highlands and Manhattan, over a billion years old in places, were once buried many kilometers down during ancient mountain-building events, then slowly uncovered as the mountains above them wore away over hundreds of millions of years. Walking across exposed bedrock in a Westchester park can mean standing on rock that formed under conditions similar to the deep crust described in this lesson.
In the real world
Scientists infer Earth's hidden layers the same way a doctor reads an ultrasound — by studying how seismic waves from earthquakes bend, speed up, or slow down as they pass through different layers deep underground.
Exit check
How does seismic evidence support a liquid outer core?
Check your explanation after answering
S waves do not propagate through liquids, and seismic shadow patterns together with P-wave behavior support a liquid outer core. Scientists infer this structure from evidence rather than drilling to it.
Explain your reasoning without notes. If a key idea is missing, revisit the lesson and try again.
Plate Boundaries
Learning goals
- I can identify divergent, convergent, and transform plate boundaries from a description or diagram.
- I can distinguish the three types of convergent boundaries and predict what landform each one creates.
- I can explain why earthquakes and volcanoes cluster along plate boundaries.
Readings for this unit
Before this unit
Describe convergence, divergence and sliding motion.
Plan three teaching sessions: core explanation and Parts 1–2; Parts 3–4 with diagrams and reasoning checks; then the whole-unit application, worked examples, independent practice, and exit check. Read one part at a time, explain it without notes, and revisit any gap. Allow about 40–50 minutes per session; adjust after checking understanding. Trace and explain the labeled figures in each part. In the third session, complete the illustrated case and changed independent application; retain a corrected explanation rather than only an answer.
Start with something to explain
How can two east-moving plates still collide?
Illustrative evidence case. Two hypothetical stations move east at 5 and 2 cm/year. A separate ridge model has youngest crust at the center and older crust on both sides.
Notice and wonder
Record two observations using the stated quantities or relationships. Keep observations separate from possible causes. Write one question that a new measurement could help answer.
How can two east-moving plates still collide?
Your first model
Draw station velocities in a common frame, then show how separation changes.
Build the language from the idea
- divergent boundary
- A place where two tectonic plates move apart, allowing magma to rise and form new crust, as at a mid-ocean ridge.
- convergent boundary
- A place where two tectonic plates move toward each other and collide.
- transform boundary
- A place where two tectonic plates slide horizontally past each other without much crust being created or destroyed.
- subduction
- The process by which a denser tectonic plate sinks beneath a less dense plate at a convergent boundary.
Earth’s lithosphere is divided into large and smaller plates that commonly move a few centimeters per year. Their motion involves interacting processes including sinking cold, dense slabs, gravitational effects associated with elevated ridges, and mantle flow. The mantle is mostly solid but deforms slowly; plates do not float on a global liquid ocean. The relative motion of neighboring plates defines divergent, convergent and transform boundaries.
At a divergent boundary, plates move apart. Rising hot mantle experiences reduced pressure, which can permit partial melting; magma can rise and cool to form new oceanic crust. Mid-ocean ridges record this process. Continental rifting can stretch and thin lithosphere, and some rifts develop into ocean basins. Not every rift has identical history or must complete that transition.
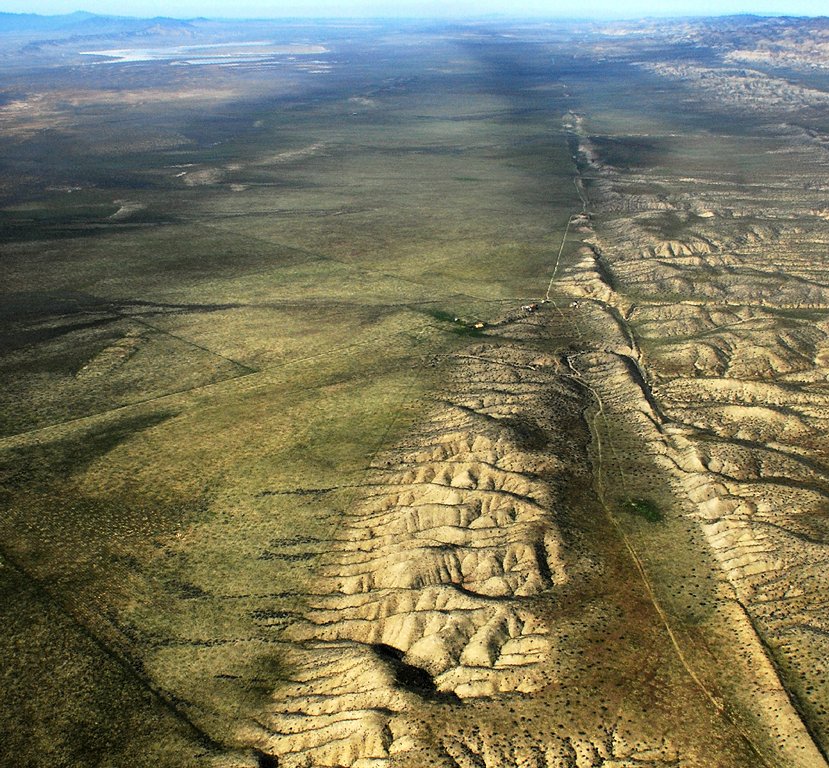
At a transform boundary, plates neither pull apart nor collide — they grind sideways past each other, like two crowded lines of traffic scraping side mirrors in slow motion. Because the rough edges snag and then suddenly lurch free, transform boundaries are famous for earthquakes; California's San Andreas Fault, where the Pacific Plate slides past the North American Plate, is the classic example. But since no crust is being created or destroyed here, transform boundaries build very few volcanoes — a handy clue when you're trying to tell the boundary types apart.
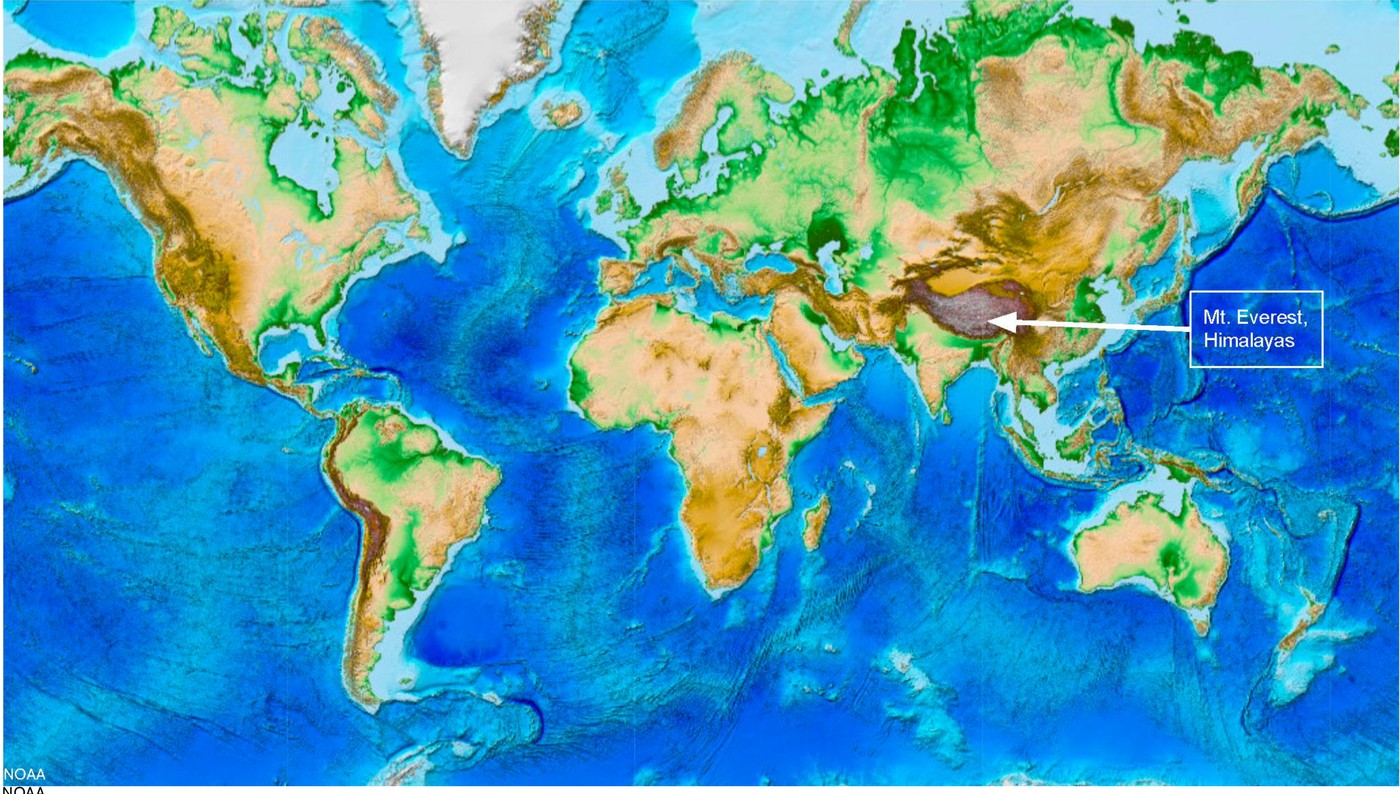
At a convergent boundary, the outcome depends on lithosphere properties, geometry and motion. Cold, dense oceanic lithosphere can subduct, producing a trench and a pattern of deepening earthquakes. Water released from the slab can promote partial melting in the overlying mantle; rising magma can support a volcanic arc. Two oceanic plates can form an island-arc setting. Continental collision commonly thickens crust and builds mountains, as in the Himalayan region; it is not the same as ordinary oceanic subduction.
One idea worth correcting: the plates are not sliding around on a layer of empty space or open liquid — they ride on the solid but slowly flowing rock of the mantle beneath them, pushed and pulled by that convection. Once you can picture the three boundary types, a pattern jumps out of any world map: almost every major earthquake and nearly every active volcano lines up along these plate edges, because that is precisely where all the pulling, grinding, colliding, and melting is concentrated. Learning to recognize the boundaries is really learning to predict where — and why — Earth's most dramatic events happen.
A plate includes crust and rigid upper mantle. At divergent boundaries plates separate and new oceanic crust can form. At convergent boundaries, subduction or continent collision depends on the materials involved. At transform boundaries plates move sideways relative to each other.
Many earthquakes and volcanoes cluster near plate boundaries, but the exact pattern depends on boundary type. Deep earthquakes are associated with subducting plates, while transform boundaries need not have a chain of volcanoes. Use both location and depth data in a comparison.
Plate movement is driven by interacting processes including the sinking of cold dense slabs and mantle circulation. A simple conveyor-belt drawing leaves out differences in viscosity, geometry and forces. Use it to visualize motion without treating it as a complete explanation of all plate behavior.
Build your understanding
Plan three teaching sessions: core explanation and Parts 1–2; Parts 3–4 with diagrams and reasoning checks; then the whole-unit application, worked examples, independent practice, and exit check. Read one part at a time, explain it without notes, and revisit any gap. Allow about 40–50 minutes per session; adjust after checking understanding.
Part 1 · Identify relative motion before landforms
Relative motion compares one object’s motion with another object rather than with a fixed map alone. Two plates can both move east, yet close their separation if the western plate moves faster. For example, west plate 5 cm/year east and east plate 2 cm/year east give closing speed 3 cm/year. Direction arrows must use the same reference frame before subtraction. Boundary type concerns this local comparison; a whole plate may have different kinds of boundary along different edges.
Read the visual model
Read the gap between adjacent blocks and the direction of each arrow. The transform panel is a top view; the other panels isolate separation or approach rather than entire plate shapes.
What happens to separation when the western plate moves east at 2 cm/year and the eastern plate east at 5 cm/year?
Visual reasoning — after your attempt
Separation increases at 3 cm/year in the stated frame, giving relative divergence rather than convergence.
A boundary describes how adjacent plates move relative to one another. Divergent motion separates them; convergent motion brings them together; transform motion moves them past one another. Arrows require a reference frame. A plate can contain ocean and continent, and one plate can border several different boundary types.
Two eastward-moving plates can converge if the trailing plate moves faster. Decide from relative separation rather than assume that arrows must face opposite directions.
Pause and explain
How can two plates moving east still converge?
Check your reasoning after answering
The western plate can move east faster, decreasing the separation.
Part 2 · Connect divergence to new oceanic lithosphere
At a spreading ridge, mantle rises as plates separate. Falling pressure can allow decompression melting, where some hot rock melts without requiring an extra temperature increase. Melt rises and cools into new oceanic crust. That crust moves away and records time since formation. In the supplied model, 120 km in 6 million years is 20 km per million years, equivalent to 2 cm/year for each side. The full plate-separation rate is twice this half-spreading rate if both sides move symmetrically.
Read the visual model
The graph has its youngest point at the ridge and older ages on both sides. Negative distance means the opposite side of the ridge, not a negative rock age.
If each side continues at 2 cm/year, what is the full separation rate, and what assumption matters?
Visual reasoning — after your attempt
It is 4 cm/year under symmetric steady spreading. Real rates and symmetry must be tested; the supplied age-distance line does not prove a constant rate for all times.
At a spreading ridge, plates separate and hot mantle rises. Reduced pressure can permit partial melting; magma cools to form new oceanic crust. Cooling material moves away, becomes denser, and thickens as lithosphere. Symmetric magnetic patterns and increasing seafloor age provide tests of spreading.
The ridge is commonly elevated because newly formed lithosphere is hot and buoyant. This connects temperature, density and topography; it does not imply that all crust floats on liquid magma.
Pause and explain
What age pattern is expected on opposite sides of a spreading ridge?
Check your reasoning after answering
Youngest seafloor near the ridge and generally older seafloor farther away on both sides.
Part 3 · Distinguish subduction from continental collision
In subduction, relatively cold oceanic lithosphere descends beneath another plate. Minerals within the slab can release water as conditions change. The added water lowers the melting conditions of parts of the overlying hot mantle, allowing partial melting. Magma can rise toward a volcanic arc above the slab. The slab does not need to melt wholesale to explain those volcanoes. An ocean trench, a band of earthquakes deepening beneath a plate and a volcanic arc together provide stronger evidence for this setting than a mountain alone.
Read the visual model
Follow the descending blue slab path, then the upward red magma pathway. These are related processes in different regions rather than one arrow tracing molten slab material.
Would mountains alone uniquely identify subduction? Name a stronger evidence combination.
Visual reasoning — after your attempt
No. A trench, earthquake depths increasing along the descending plate and an appropriately located volcanic arc together support subduction more strongly. Continental collision can also make high mountains.
Cold oceanic lithosphere can descend at a convergent boundary. Released water can promote partial melting in the overlying mantle, supporting a volcanic arc. Continental collision commonly thickens crust and raises mountains; it does not create the same typical oceanic subduction setting in every case.
A trench, volcanic arc and earthquakes deepening inland form a related evidence pattern. A mountain chain alone is less diagnostic because several processes can make high terrain.
Pause and explain
Why is a trench plus deepening earthquake pattern stronger evidence than mountains alone?
Check your reasoning after answering
The combined spatial pattern specifically supports a descending plate; mountains have multiple possible causes.
Part 4 · Explain forces and evaluate a boundary model
A transform boundary connects regions undergoing lateral relative motion. Fault segments can resist sliding through friction while neighboring rock deforms. When slipping occurs, the strain release can produce an earthquake. This explains why a boundary without the typical creation of new crust at a ridge can still be hazardous. Plate motion also responds to slab pull, ridge-related gravity and mantle interactions; no single circular-arrow picture fixes every plate’s behavior. Distinguish the direction of plate movement from whether a particular fault patch is currently locked.
Read the visual model
The two arrows pass the common boundary in opposite directions in a top view. They are not a spreading-ridge cross-section.
Why can a transform fault produce earthquakes without a chain of subduction volcanoes?
Visual reasoning — after your attempt
Locked sections can store elastic strain and release it during slip. That mechanism does not require the water-assisted mantle melting typical of a subduction arc.
Plate motion involves interactions including sinking slabs, gravitational effects at elevated ridges, and mantle flow. Transform faults accommodate lateral displacement without a typical net creation or destruction of lithosphere at that boundary. Real boundaries can be complex and change through time.
A boundary model should predict motion, crustal change and evidence together. Compare those predictions with earthquakes, volcanoes, landforms and measured plate movement instead of naming a type from one surface feature.
Pause and explain
Must a transform boundary have a volcanic chain?
Check your reasoning after answering
No. Lateral fault motion commonly produces earthquakes without the typical subduction or ridge volcanic mechanism.
Apply the whole unit · Classify three evidence patterns
Illustrative locations: A has young seafloor at an elevated ridge; B has a trench and inland-deepening earthquakes; C has offset roads and shallow earthquakes along a lateral fault.
Your task
Classify each boundary, draw relative-motion arrows, explain its lithosphere effect, and identify evidence needed to test your interpretation.
What your response should show
- Use the supplied evidence accurately and label units or locations.
- Explain a physical mechanism or evidence-to-claim relationship.
- Show calculations or a clearly labeled model when the task calls for one.
- Identify a meaningful assumption, uncertainty, or competing explanation.
Response guidance — after your attempt
A supports divergence/new lithosphere; B supports convergence/subduction; C supports transform motion. Use the combined patterns and seek measured movement, crustal ages, or additional seismic evidence. A single feature does not uniquely settle every boundary.
Scientific references and adapted source material
- USGS — development of plate tectonic evidence
- OpenSciEd 6.4 — plate tectonics and rock cycling
- OpenSciEd middle-school material — CC BY 4.0 license
Parent / teacher teaching notes
Use paper blocks for relative motion, but label what the blocks omit. Check that the learner explains decompression melting and subduction-related water without treating the mantle as a soup. Ask the learner to explain each visual label and causal step before calculating. Preserve a first model, attempt the changed independent case, then use feedback to revise. Diagrams state whether values are illustrative or observed. Selected OpenSciEd excerpts are middle-school source material used for supported foundations; the independent high-school explanations and supplements are not the complete OpenSciEd teacher editions or an endorsement.
An animation of two tectonic plates that switches between divergent (pulling apart), convergent (colliding), and transform (sliding past each other) motion.
The key idea
Plates diverge, converge, or slide past each other at transform boundaries, and most earthquakes and volcanoes happen right along these edges.
Rate of Plate Motion
rate = distance ÷ time
distance is how far a plate has shifted (cm or km) and time is the elapsed years; most plates creep along at about 2–10 cm per year, roughly the speed fingernails grow.
Density and Subduction
density = mass ÷ volume
denser oceanic crust (basalt, ≈3.0 g/cm³) always sinks beneath lighter continental crust (granite, ≈2.7 g/cm³) at a convergent boundary — the denser plate subducts.
Worked examples
Example 1
- The plates are colliding, not pulling apart or sliding sideways, so this rules out divergent and transform boundaries — it must be convergent.
- Both plates are continental, so neither is dense enough to subduct into the mantle.
- With no subduction, there's no melting magma to feed volcanoes — instead, the crust just crumples and folds upward.
Example 2 · Worked application
- Denser oceanic lithosphere can subduct beneath the continent.
- A trench, earthquakes and a continental volcanic arc are consistent features.
Not every convergent boundary has the same plate types.
Example 3
- Two plates are moving toward each other, so this is a convergent boundary.
- The denser oceanic plate is described as sliding underneath the continental plate — that's subduction.
- Oceanic-continental subduction produces a chain of volcanoes and a deep trench right along the coast, matching the description.
Example 4
- The depth pattern indicates a descending slab.
- Dense oceanic lithosphere can subduct beneath continental lithosphere.
Example 5 · Find and fix the mistake
- Test the claim against the stated conditions: Not every convergent boundary has the same plate types.
- Continental collision can build mountains without the same oceanic subduction pattern. Identify plate types before predicting.
Not every convergent boundary has the same plate types.
Example 6 · Reason from the visual evidence
- Follow the descending blue slab path, then the upward red magma pathway. These are related processes in different regions rather than one arrow tracing molten slab material.
- No. A trench, earthquake depths increasing along the descending plate and an appropriately located volcanic arc together support subduction more strongly. Continental collision can also make high mountains.
This original cross-section shows an ideal oceanic subduction setting. Layer thicknesses, angles and distances are exaggerated. The rising red arrow marks a magma pathway after water-assisted mantle melting; the diagram does not locate an actual monitored volcano or predict its eruptions.
Avoid these mistakes
- Every convergent boundary does not produce the same landforms.
Check your understanding
An oceanic plate approaches a continental plate and earthquake depths increase inland. Explain the likely boundary.
Discuss the answer
An oceanic–continental convergent boundary with a subducting oceanic plate is consistent with the evidence.
Why are deep earthquakes useful evidence for subduction?
Discuss the answer
Earthquake depths increasing along a dipping zone, together with trench/arc and relative-motion evidence, support a descending slab. Mountains or one isolated deep event alone provide less complete constraints.
Return to the phenomenon
Return to the initial case. How can two east-moving plates still collide? Revise your drawing or explanation using two named ideas and one stated limitation.
Compare explanations after your attempt
The faster western plate catches the eastern plate at 3 cm/year in that case. Boundary classification uses relative motion; seafloor age patterns test formation and spreading in a different setting.
What should we investigate next?
Which comparison would test a remaining uncertainty? State what you would change, keep comparable and measure.
Investigate, explain and revise
Complete the tasks after studying the visual parts. Keep the first model and explain a revision before consulting the guidance.
Activity 1 · Explain the opening case
Use this unit’s opening record, Parts 1–4 and your notebook model. No external equipment or text is required for this supplied-data route.
Your task
Return to the initial case. How can two east-moving plates still collide? Revise your drawing or explanation using two named ideas and one stated limitation.
Success criteria
- Use two stated observations or conditions.
- Connect the mechanism to a labeled diagram or calculation.
- Identify what your original model missed.
- State a useful further test and a limitation.
Hint
Name the quantities and interactions before assigning a cause.
Response guidance — discuss after your attempt
The faster western plate catches the eastern plate at 3 cm/year in that case. Boundary classification uses relative motion; seafloor age patterns test formation and spreading in a different setting.
Activity 2 · Transfer to a changed case
Use the figures, captions and vocabulary in this unit; cover the worked answer.
Your task
West and east stations on adjacent plates both move east: west 6 cm/year and east 2 cm/year in one reference frame. Find the relative closing rate. Explain why this alone does not prove a subduction zone.
Success criteria
- Use the stated measurements or conditions, with correct units.
- Connect the result to the physical mechanism or evidence relationship.
- Identify the assumption, model limit or further evidence requested.
Hint
Separate measured values, calculated results and model assumptions.
Response guidance — discuss after your attempt
The gap closes at 6−2 = 4 cm/year. Relative convergence is established, but plate types, trench geometry, earthquake depths and geological evidence are needed to distinguish subduction from other convergent settings.
Words to know
- divergent boundary
- A place where two tectonic plates move apart, allowing magma to rise and form new crust, as at a mid-ocean ridge.
- convergent boundary
- A place where two tectonic plates move toward each other and collide.
- transform boundary
- A place where two tectonic plates slide horizontally past each other without much crust being created or destroyed.
- subduction
- The process by which a denser tectonic plate sinks beneath a less dense plate at a convergent boundary.
Clocking the plates: GPS and the pace of continents
Precise GPS stations bolted into bedrock all over the world now track plate motion in real time, and the numbers back up the 'fingernail growth' comparison almost exactly — most plates creep along at roughly 2 to 10 centimeters per year. The fastest-moving plates, like sections of the Pacific plate, can travel more than twice as fast as the slowest ones, like parts of the Eurasian plate. Multiply even a slow 2 cm/year by a few million years, though, and that's enough motion to open an entire ocean basin or stack up a mountain range.
What's really pulling the plates — slab pull vs. ridge push
It's tempting to picture mantle convection as a conveyor belt that simply drags the plates along on top, but most geologists now think the plates themselves are doing much of the driving. When a cold, dense old slab of oceanic crust starts sinking at a subduction zone, its own weight pulls the rest of the plate along behind it — a force called slab pull, thought to be the single strongest force in plate tectonics. A weaker push also comes from ridge push, where newly formed crust at a mid-ocean ridge is elevated and slides gradually downhill under its own weight. Mantle convection still matters, but it's more of a supporting engine than a conveyor belt.
The Wilson Cycle: how oceans are born, grow old, and die
Ocean basins aren't permanent — they're born at divergent boundaries, widen for tens or hundreds of millions of years, and eventually close back up at convergent boundaries as their edges are pulled into subduction zones, in a repeating pattern geologists call the Wilson Cycle. The Atlantic Ocean is still in its growing phase today, but the ancient Iapetus Ocean that once separated pieces of what became North America and Europe closed completely hundreds of millions of years ago, its collision building the earliest Appalachian Mountains before the Atlantic later opened in roughly the same place. Some geologists predict a future supercontinent, sometimes called Pangaea Proxima, forming as the Atlantic eventually closes again.
New York: no boundary today, but plenty of scars from old ones
It might seem odd that a plate-boundary unit barely mentions New York — that's because the Empire State sits firmly in the middle of the North American Plate today, on what geologists call a passive margin, far from the nearest actively colliding edge. But it wasn't always this quiet: the folded, uplifted rock of the Appalachian Mountains, including the Hudson Highlands, records at least three ancient mountain-building collisions (the Taconic, Acadian, and Alleghanian orogenies) that happened when this region sat on an active plate boundary hundreds of millions of years ago, long before the Atlantic Ocean even existed in its current form.
In the real world
Iceland sits directly on top of the Mid-Atlantic Ridge, so visitors can literally stand in the rift valley where the North American and Eurasian plates are pulling apart a few centimeters every year.
Exit check
Compare what happens to crust at a mid-ocean ridge and a subduction zone.
Check your explanation after answering
At a ridge, plates separate and magma forms new oceanic crust. At a subduction zone, a plate descends and lithosphere is recycled; associated melting can supply volcanoes.
Explain your reasoning without notes. If a key idea is missing, revisit the lesson and try again.
Earthquakes & Volcanoes
Learning goals
- I can distinguish the focus (hypocenter) of an earthquake from its epicenter.
- I can compare P-waves, S-waves, and surface waves and explain how the magnitude scale works.
- I can compare shield, composite, and cinder cone volcanoes and explain how hot spots differ from boundary volcanism.
Readings for this unit
Before this unit
Read travel-time graphs and distinguish a hazard from a forecast.
Plan three teaching sessions: core explanation and Parts 1–2; Parts 3–4 with diagrams and reasoning checks; then the whole-unit application, worked examples, independent practice, and exit check. Read one part at a time, explain it without notes, and revisit any gap. Allow about 40–50 minutes per session; adjust after checking understanding. Trace and explain the labeled figures in each part. In the third session, complete the illustrated case and changed independent application; retain a corrected explanation rather than only an answer.
Start with something to explain
Why can one earthquake produce different effects in different places?
Illustrative evidence case. Two towns report different shaking from one event. A station records an early P arrival and a later S arrival.
Notice and wonder
Record two observations using the stated quantities or relationships. Keep observations separate from possible causes. Write one question that a new measurement could help answer.
Why can one earthquake produce different effects in different places?
Your first model
Separate earthquake source, travel path, ground conditions and building response in a drawing.
Build the language from the idea
- focus (hypocenter)
- The point underground where an earthquake's rupture begins and energy is first released.
- epicenter
- The point on Earth's surface located directly above the focus.
- seismic wave
- Energy released by an earthquake that travels through Earth as vibrations, including P-waves, S-waves, and surface waves.
- hot spot
- An area of unusually intense volcanic activity above a rising plume of hot mantle rock, active even in the middle of a plate, far from any boundary.
An earthquake is what happens when stress that has been quietly building for years — sometimes centuries — is released all at once. As tectonic plates try to move past each other, friction locks their edges together along a crack in the crust called a fault, so the rock bends and stores up energy like a stick you slowly flex. Eventually the rock can't take any more, it snaps and slips, and all that stored energy is unleashed as violent shaking. The exact spot underground where the rupture begins is the focus (also called the hypocenter), and the point on the surface directly above it — usually where the shaking is strongest — is the epicenter.
The released energy races outward through the planet as seismic waves, which sensitive instruments called seismographs record. They don't all travel the same way. P-waves (primary waves) arrive first because they're fastest, pushing and pulling the rock forward and back like a squeezed spring, and they can move through solids and liquids alike. S-waves (secondary waves) come next, shaking the rock from side to side — and crucially, they cannot pass through liquid at all, which is one of the clues that first revealed Earth's outer core is molten. Surface waves arrive last and travel along the ground itself; even though they're the slowest, they usually do the most damage, because they roll through the very surface where our buildings stand.
The size of an earthquake is reported as its magnitude, and the scale hides a sneaky twist: it isn't a plain 1-2-3 count, it's logarithmic, so each whole step up represents about 10 times more ground-shaking than the step below it. That means a magnitude 6 doesn't shake just a bit more than a magnitude 5 — it shakes roughly 10 times more, and a magnitude 7 shakes about 10 times more again, a full 100 times the shaking of that magnitude 5. It's why the difference between a 'moderate' quake and a 'great' one is so enormous even though the numbers look close together.
Volcanoes form when magma reaches the surface. At spreading settings, pressure reduction in rising mantle can permit partial melting. At subduction settings, released water can promote melting in the overlying mantle; the simplistic claim that the entire descending slab melts is not the general mechanism. Some magma solidifies below the surface rather than erupting.
Some volcanic regions occur away from plate boundaries and are described as hot spots. Hot rising mantle and partial melting can contribute, while their detailed structures and histories vary. A moving plate over a relatively persistent magma-source region can produce an age-progressive volcanic chain, as in Hawaii. A candle burning through paper is only a rough position analogy; it does not represent the actual melting process or require every hot spot to stay perfectly fixed.
Volcanoes also come in different shapes depending on how runny their magma is. Shield volcanoes are broad and gently sloped because their thin, runny basaltic lava spreads far before it hardens — Hawaii's volcanoes are the classic example. Composite volcanoes (or stratovolcanoes) are the steep, cone-shaped, picture-postcard peaks like Mt. Fuji or Mt. St. Helens, built from alternating layers of ash and thick, sticky lava that tends to erupt explosively. Cinder cones are the smallest, steep piles of loose fragments blasted from a single vent. Trace all the subduction-zone volcanoes and earthquakes around the edges of the Pacific Ocean and they connect into a giant horseshoe known as the Ring of Fire — a direct, visible map of where plates are grinding together beneath the sea.
An earthquake releases stored elastic energy when rock slips along a fault. Magnitude describes the event's size; intensity describes effects at a particular location. Intensity also depends on distance, local ground and construction, so one earthquake can produce different intensities.
P waves arrive before S waves at a typical station. The time difference can be compared with a travel-time model to estimate distance. One station generally gives a distance rather than a unique map location; multiple station circles help locate an epicenter.
A volcano's behavior depends partly on magma composition, gas and viscosity. Monitoring changes can inform risk, but a simple pattern does not guarantee an exact eruption time. Communicate probability and limitations rather than promising that a single measurement predicts an event.
Build your understanding
Plan three teaching sessions: core explanation and Parts 1–2; Parts 3–4 with diagrams and reasoning checks; then the whole-unit application, worked examples, independent practice, and exit check. Read one part at a time, explain it without notes, and revisit any gap. Allow about 40–50 minutes per session; adjust after checking understanding.
Part 1 · Stress, elastic strain and fault rupture
Stress is force acting over area within a material; elastic strain is reversible deformation caused by that stress. A locked fault lets strain accumulate as neighboring rock continues to move. The focus, or hypocenter, is where an earthquake’s rupture begins inside Earth. The epicenter is the point directly above it on the surface, not a second source of the earthquake. Rupture can spread across a much larger fault area after starting. Its depth, direction and released energy matter for shaking, so a single surface dot cannot describe all effects.
Read the visual model
Follow the dashed projection from the red subsurface start point to the blue surface point. The diagonal line is the selected fault surface.
If the rupture starts 12 km below a town, which term names the start point and which names its surface projection?
Visual reasoning — after your attempt
The subsurface start is the focus or hypocenter; the town’s projected point is the epicenter. The distinction concerns position, not two separate earthquakes.
A locked fault can accumulate elastic strain as surrounding rock deforms. When slipping begins, stored energy is released through seismic waves and other processes. The focus is the starting location within Earth; the epicenter is its surface projection. Fault type describes motion and stress, not a guarantee of a particular magnitude.
A normal fault involves extension, a reverse fault compression, and a strike-slip fault lateral displacement. Draw relative block motion and distinguish the initial rupture location from the whole area that later slips.
Pause and explain
Why is the focus not the same as the epicenter?
Check your reasoning after answering
The focus is within Earth; the epicenter is the location directly above it at the surface.
Part 2 · Read seismic arrivals and shaking evidence
A travel-time curve links travel distance to elapsed time from an earthquake’s origin under a stated velocity model. A station can compare the first P-wave arrival with the later S-wave arrival without knowing the exact origin time. At 200 km in this deliberately simple model, P arrives after 40 s and S after 70 s, giving an S–P interval of 30 s. Use the appropriate reference curve for real locations; Earth’s layered structure does not have the constant velocities implied by these straight lines. Shaking intensity also varies with ground and structures, not just this time gap.
Read the visual model
Subtract times at one horizontal distance, not distances at a single arrival time. The gap is between arrivals from the same event and station.
What S–P interval occurs at 300 km in this supplied model, and can it identify a unique direction to the earthquake?
Visual reasoning — after your attempt
105−60 = 45 s. It constrains distance under the model but not a unique direction; additional station information is needed.
P waves usually arrive before S waves at the same station because they travel faster along comparable paths. Surface waves can contribute strongly to damaging shaking. Arrival times help constrain distance and location; shaking effects also depend on depth, distance, ground conditions and structures.
Two towns can experience different intensity from the same earthquake. A station reading or magnitude is not a direct measure of every building’s damage. Compare local geology and construction when explaining the difference.
Pause and explain
Can one earthquake have different intensities in different towns?
Check your reasoning after answering
Yes. Intensity describes local effects, influenced by distance, ground and structures.
Part 3 · Why magma forms and rises
Rock begins melting when its temperature, pressure and composition meet suitable conditions. Rising mantle can cross its melting conditions as pressure decreases; this is decompression melting. Water released in a subduction setting can lower the temperature needed for some mantle material to melt. Hot magma can also transfer energy into other rock. Each mechanism changes a different part of the condition comparison, and usually only some material melts. Magma is melt containing possible crystals and gases beneath the surface; lava is erupted molten material at the surface.
Read the visual model
Name which condition changes in each panel. The boxes stand for selected rock regions, while arrow color distinguishes pressure-related rise, water addition and energy transfer.
Why is “it got hotter” not the only possible explanation for magma formation?
Visual reasoning — after your attempt
Reduced pressure or added water can permit partial melting without the same required temperature rise. The setting and evidence identify which mechanism is appropriate.
Magma can form through decompression, added water lowering melting conditions, or heat transfer in appropriate settings. Buoyant magma rises through fractures and passages, but not all reaches the surface. Subduction arcs, spreading ridges and hot spots have different geological relationships.
The mantle above a descending slab can partly melt when water is released from the slab. Avoid the simple claim that friction automatically melts the entire sinking plate.
Pause and explain
How does added water help explain a subduction-related volcanic arc?
Check your reasoning after answering
It changes melting conditions in the overlying mantle, allowing partial melting under appropriate conditions.
Part 4 · Eruption style, monitoring and uncertainty
Viscosity describes resistance to flow. More viscous magma can retain gases differently from more fluid magma, influencing pressure buildup and eruption behavior. But composition, temperature, gas content and pathways interact, so one property does not guarantee an eruption style. Monitoring combines seismicity, surface deformation and gas measurements to look for changes in the system. Deformation here is measurable ground-shape change, potentially linked to movement or pressure below. Interpreting several indicators together helps distinguish explanations; it is not an exact eruption clock.
Read the visual model
The two indices increase over the same monitoring interval. They have illustrative index units, so compare timing of changes rather than treating equal heights as identical physical quantities.
Why does a rise in both indicators support further investigation rather than prove an eruption will happen tomorrow?
Visual reasoning — after your attempt
The changes are consistent with a changing volcanic system but have alternative causes, uncertainties and no exact-time calibration in this graph. Combine gas, deformation and seismic evidence with expert monitoring.
Eruption behavior depends on interacting factors including composition, temperature, viscosity and gas. Viscous magma can trap gas, increasing explosive potential; this is a relationship, not a perfect rule for every eruption. Monitoring combines seismicity, deformation and gas observations to evaluate changes.
An increase in small earthquakes can indicate changing conditions, but it does not supply an exact date and magnitude for an eruption or earthquake. Distinguish a risk assessment from a certain event prediction.
Pause and explain
Why should increased volcanic earthquakes be interpreted with deformation and gas data?
Check your reasoning after answering
Several processes can cause seismic changes; independent observations help test whether magma movement is the explanation.
Apply the whole unit · Two towns, one earthquake
Illustrative case: towns A and B are equally distant from the epicenter. A rests on firm bedrock with strengthened buildings; B rests on soft sediment with older vulnerable buildings and reports greater damage.
Your task
Explain two plausible contributors to different intensity, separate magnitude from damage, and propose additional evidence for comparing the towns.
What your response should show
- Use the supplied evidence accurately and label units or locations.
- Explain a physical mechanism or evidence-to-claim relationship.
- Show calculations or a clearly labeled model when the task calls for one.
- Identify a meaningful assumption, uncertainty, or competing explanation.
Response guidance — after your attempt
The earthquake has one event magnitude but local effects differ. Sediment-related amplification and structural vulnerability are plausible; compare recordings, building types and ground conditions before attributing all damage to one factor.
Scientific references and adapted source material
Parent / teacher teaching notes
Ask for an observation-to-mechanism chain. Keep monitoring interpretation and classroom cases separate from operational emergency advice or claimed exact predictions. Ask the learner to explain each visual label and causal step before calculating. Preserve a first model, attempt the changed independent case, then use feedback to revise. Diagrams state whether values are illustrative or observed. Selected OpenSciEd excerpts are middle-school source material used for supported foundations; the independent high-school explanations and supplements are not the complete OpenSciEd teacher editions or an endorsement.
The key idea
Earthquakes release built-up stress along faults, and volcanoes erupt where magma reaches the surface — mostly at plate boundaries, but also at hot spots far from any boundary.
Estimating Distance to an Epicenter (S–P method)
distance (km) ≈ 8 × (S-wave arrival time − P-wave arrival time, in seconds)
P-waves always outrun S-waves through the crust; the bigger that arrival-time gap, the farther away the epicenter. This is an approximation using typical crustal wave speeds.
Earthquake Magnitude & Shaking
amplitude ratio = 10^(M₂ − M₁)
M₁ and M₂ are two earthquake magnitudes; each whole-number increase on the scale multiplies ground-shaking amplitude by about 10×.
Worked examples
Example 1
- The magnitude scale is logarithmic: each whole number increase means about 10× more shaking.
- From magnitude 5 to 7 is a jump of 2 whole numbers (5 → 6 → 7).
- Multiply the 10× jump twice: 10 × 10 = 100.
Example 2 · Worked application
- P waves generally travel faster along comparable paths.
- A greater arrival-time separation usually indicates greater source distance using a calibrated travel-time model.
Use the supplied model rather than assuming one speed for all Earth layers.
Example 3
- P-waves always travel faster than S-waves, so the farther the waves travel, the more the faster P-wave pulls ahead and the bigger the time gap between them becomes.
- A large gap between P-wave and S-wave arrival means the waves traveled a long distance — that station is far from the epicenter.
- A tiny gap means the waves didn't have much distance to separate over, so that station is close to the epicenter.
Example 4
- Compare local ground, building design and duration of strong shaking.
- Damage is a local effect, not a direct measurement of event magnitude alone.
Example 5 · Find and fix the mistake
- Test the claim against the stated conditions: Use the supplied model rather than assuming one speed for all Earth layers.
- It gives a distance locus; multiple stations or additional directional evidence are needed to locate the epicenter.
Use the supplied model rather than assuming one speed for all Earth layers.
Example 6 · Reason from the visual evidence
- Name which condition changes in each panel. The boxes stand for selected rock regions, while arrow color distinguishes pressure-related rise, water addition and energy transfer.
- Reduced pressure or added water can permit partial melting without the same required temperature rise. The setting and evidence identify which mechanism is appropriate.
Three original condition-change models compare decompression, water-assisted melting and heat input. The figure is qualitative and does not specify a real rock’s melting curve. Blue marks water addition; red arrows do not represent a measured lava flow.
Avoid these mistakes
- Magnitude and local shaking intensity measure different things.
Check your understanding
Two towns equally far from an earthquake report different damage. Give a plausible explanation and evidence to collect.
Discuss the answer
Different soils or buildings can produce different damage; site and construction evidence is needed.
Why does one seismic station usually not locate a unique epicenter?
Discuss the answer
An arrival gap constrains distance under a travel-time model, allowing many directions around one station. Additional stations and appropriate velocity/uncertainty information are needed to narrow a location.
Return to the phenomenon
Return to the initial case. Why can one earthquake produce different effects in different places? Revise your drawing or explanation using two named ideas and one stated limitation.
Compare explanations after your attempt
Arrival gaps constrain paths/distances under a model, while intensity and damage also depend on depth, ground and structures. Focus and epicenter locate different points; neither alone is a damage map.
What should we investigate next?
Which comparison would test a remaining uncertainty? State what you would change, keep comparable and measure.
Investigate, explain and revise
Complete the tasks after studying the visual parts. Keep the first model and explain a revision before consulting the guidance.
Activity 1 · Explain the opening case
Use this unit’s opening record, Parts 1–4 and your notebook model. No external equipment or text is required for this supplied-data route.
Your task
Return to the initial case. Why can one earthquake produce different effects in different places? Revise your drawing or explanation using two named ideas and one stated limitation.
Success criteria
- Use two stated observations or conditions.
- Connect the mechanism to a labeled diagram or calculation.
- Identify what your original model missed.
- State a useful further test and a limitation.
Hint
Name the quantities and interactions before assigning a cause.
Response guidance — discuss after your attempt
Arrival gaps constrain paths/distances under a model, while intensity and damage also depend on depth, ground and structures. Focus and epicenter locate different points; neither alone is a damage map.
Activity 2 · Transfer to a changed case
Use the figures, captions and vocabulary in this unit; cover the worked answer.
Your task
In a stated travel-time model, P arrives at 50 s and S at 86 s at one station. Calculate the S–P gap. Explain why neither that gap nor the epicenter alone establishes shaking damage at every town.
Success criteria
- Use the stated measurements or conditions, with correct units.
- Connect the result to the physical mechanism or evidence relationship.
- Identify the assumption, model limit or further evidence requested.
Hint
Separate measured values, calculated results and model assumptions.
Response guidance — discuss after your attempt
The S–P gap is 36 s. Distance inference needs the appropriate travel-time model; direction requires other stations. Damage also depends on local intensity, depth, ground and structures, so one gap or surface location is insufficient.
Words to know
- focus (hypocenter)
- The point underground where an earthquake's rupture begins and energy is first released.
- epicenter
- The point on Earth's surface located directly above the focus.
- seismic wave
- Energy released by an earthquake that travels through Earth as vibrations, including P-waves, S-waves, and surface waves.
- hot spot
- An area of unusually intense volcanic activity above a rising plume of hot mantle rock, active even in the middle of a plate, far from any boundary.
Shaking vs. energy: the magnitude scale has two different jumps
The main lesson's '10 times more shaking per whole number' describes ground amplitude — but the actual energy released grows even faster, by about 31.6 times for every whole-number increase in magnitude. That means a magnitude 7 earthquake doesn't just shake 100 times more than a magnitude 5 (10 × 10) — it releases roughly 1,000 times more energy (31.6 × 31.6 ≈ 1,000). Modern scientists also mostly use a related but improved scale, the moment magnitude scale, which measures the total energy released using the size of the fault rupture and how far it slipped, since the older Richter scale becomes unreliable for very large earthquakes.
Prediction vs. forecasting — and racing the P-wave
Despite decades of research, no one can reliably predict the exact day an earthquake will strike. What scientists can do is forecast long-term probabilities — for example, estimating there's a roughly 70% chance of a major earthquake hitting the San Francisco Bay Area in the next 30 years, based on how much stress has built up along known faults. Modern earthquake early warning systems, like the West Coast's ShakeAlert, exploit the fact that P-waves outrun the more destructive S-waves and surface waves: sensors detect the fast, weak P-wave first and blast out a warning — sometimes tens of seconds — before the damaging shaking arrives.
Why some volcanoes explode and others just ooze
A volcano's personality comes down to its magma's chemistry, especially how much silica it contains. Low-silica, runny basaltic magma lets gas bubbles escape easily, producing the gentle lava flows of shield volcanoes like Hawaii's. High-silica, thick, sticky magma traps expanding gases until they burst violently, producing the explosive eruptions of composite volcanoes. Scientists rank eruption size on the Volcanic Explosivity Index (VEI), similar in spirit to the earthquake magnitude scale — Mt. St. Helens in 1980 was a VEI 5, while a true supervolcano eruption, like the one that shaped Yellowstone's caldera hundreds of thousands of years ago, can reach VEI 8, ejecting over 1,000 times more material.
The 1906 quake that explained earthquakes
For most of history, no one really understood why earthquakes happened. That changed after the devastating 1906 San Francisco earthquake, when geologist Harry Fielding Reid studied surveyors' measurements of the ground before and after the quake and noticed the land on either side of the San Andreas Fault had slowly bent for years before suddenly snapping back into alignment. His elastic rebound theory — that rock bends like a stretched spring under stress until it fractures and springs back, releasing energy as an earthquake — is still the basic model geologists use to explain earthquakes today.
New York has faults too — meet the Ramapo
Earthquakes aren't only a West Coast story. The Ramapo Fault, an ancient zone of weakness running through parts of Rockland, Orange, and Westchester counties, is a reminder that New York sits within the North American Plate's interior, not on its edge — yet places far from plate boundaries can still experience 'intraplate' earthquakes when regional stresses reactivate old, weakened rock. New York State has recorded a number of small-to-moderate quakes over the centuries, including a magnitude 5.8 near Massena in 1944 that cracked chimneys and building facades — a good reminder that plate tectonics still leaves its fingerprints far from active boundaries.
In the real world
Seismographs let scientists issue tsunami warnings within minutes of a major undersea earthquake, and volcano monitoring lets geologists sometimes evacuate towns days before an eruption.
Exit check
Why does knowing a plate boundary’s location help estimate hazard but not an exact earthquake date?
Check your explanation after answering
Boundaries concentrate deformation and earthquakes. Location and history help estimate probabilities, but they do not specify exactly when stored stress will be released.
Explain your reasoning without notes. If a key idea is missing, revisit the lesson and try again.
Evidence for Continental Drift
Learning goals
- I can describe Alfred Wegener's continental drift hypothesis and the supercontinent Pangaea.
- I can explain how matching fossils, rock layers, continental shapes, and climate evidence support continental drift.
- I can explain how seafloor spreading and paleomagnetism finally gave continental drift a mechanism.
Readings for this unit
Before this unit
Compare independent lines of evidence.
Plan three teaching sessions: core explanation and Parts 1–2; Parts 3–4 with diagrams and reasoning checks; then the whole-unit application, worked examples, independent practice, and exit check. Read one part at a time, explain it without notes, and revisit any gap. Allow about 40–50 minutes per session; adjust after checking understanding. Trace and explain the labeled figures in each part. In the third session, complete the illustrated case and changed independent application; retain a corrected explanation rather than only an answer.
Start with something to explain
What makes continental drift stronger than a puzzle-piece guess?
Illustrative evidence case. Separated regions contain matching fossil groups in comparable-age strata. A ridge has young crust near its center and older crust farther away.
Notice and wonder
Record two observations using the stated quantities or relationships. Keep observations separate from possible causes. Write one question that a new measurement could help answer.
What makes continental drift stronger than a puzzle-piece guess?
Your first model
Draw a proposed past connection and list independent patterns it should explain.
Build the language from the idea
- continental drift
- Alfred Wegener's idea that continents were once joined together and have since slowly moved to their current positions.
- Pangaea
- The single supercontinent that Wegener proposed all of today's continents were once joined together as, before it broke apart.
- seafloor spreading
- The process by which new ocean floor forms at mid-ocean ridges and spreads outward in both directions, providing the mechanism for continental drift.
- paleomagnetism
- Magnetic patterns frozen into ocean-floor rock as it cooled, recording the direction of Earth's magnetic field at the time — used as evidence for seafloor spreading.
In 1912, a German scientist named Alfred Wegener pointed out something that feels obvious once someone shows you: the eastern coastline of South America and the western coastline of Africa look like they'd click together, like two pieces torn from the same puzzle. Wegener proposed that all of today's continents were once joined into a single gigantic supercontinent he named Pangaea (Greek for 'all land'), which later broke apart, its pieces slowly drifting to the positions we see on the map today. That idea — continents wandering across the globe over vast stretches of time — became known as continental drift.
A coastline hunch isn't proof, so Wegener piled up evidence. Identical fossils of the same land and freshwater species — the reptile *Mesosaurus*, the fern-like plant *Glossopteris* — show up on continents now separated by thousands of kilometers of open ocean, even though neither creature could possibly have swum or floated across. Whole mountain ranges match up too: the Appalachians of eastern North America line up with ranges in Scotland and Scandinavia as if a single belt of folded rock had been torn in half and the halves floated apart.
Ancient glacial deposits and striations in presently warm regions can constrain past positions and conditions. Coal-bearing deposits also record past environments favorable for organic accumulation and preservation, but coal does not form only in tropical climates. Interpret these indicators with dated rocks, regional geology and other evidence; present latitude alone does not describe the entire history.
Despite the mountain of evidence, most scientists dismissed Wegener's idea for nearly fifty years — and for a fair reason: he couldn't explain *how* something as colossal as a continent could possibly plow through solid ocean floor. That missing piece is a great lesson in how science works, because a hypothesis usually isn't accepted until someone can show a believable mechanism. The mechanism finally turned up in the 1960s with the discovery of seafloor spreading — the process by which fresh ocean crust is born at mid-ocean ridges and spreads outward in both directions, like a slow conveyor belt carrying the continents along rather than dragging them through solid rock.
The proof of seafloor spreading came from paleomagnetism. As new ocean floor cools at a ridge, iron-bearing minerals in it freeze into place pointing toward Earth's magnetic field — and because that field flips direction every so often over geologic time, the seafloor recorded the reversals as a pattern of magnetic stripes, laid down in a perfectly matching mirror image on both sides of the ridge. That symmetry could only mean the floor was spreading outward from the center. With a real mechanism finally in hand, continental drift was absorbed into the powerful modern theory of plate tectonics — a reminder that even an idea scientists once laughed at can turn out to be right, once the evidence and a mechanism line up. Modern satellite instruments can now detect the plates still creeping along, confirming Wegener's once-ridiculed vision in numbers he could never have gathered himself.
Matching coastlines are suggestive, but continental margins and their shapes change through time. Fossils, matching rock belts and past-climate indicators across separated continents provide stronger combined evidence for former connections.
Seafloor spreading added evidence that the earlier continental-drift model lacked. Symmetric magnetic patterns and increasingly old ocean-floor rocks away from ridges support creation and movement of crust. A model gains strength when it explains independent observations with one mechanism.
Compare alternative explanations and the distribution of evidence. Similar fossils could sometimes reflect dispersal, but matching ancient land organisms, rock structures and glacial traces together demand an explanation. Historical scientific models changed when new measurements resolved earlier weaknesses.
Build your understanding
Plan three teaching sessions: core explanation and Parts 1–2; Parts 3–4 with diagrams and reasoning checks; then the whole-unit application, worked examples, independent practice, and exit check. Read one part at a time, explain it without notes, and revisit any gap. Allow about 40–50 minutes per session; adjust after checking understanding.
Part 1 · A hypothesis with multiple predictions
Continental drift describes the idea that continents changed their positions through time. Matching outlines suggested a reconstruction, but coastlines can change as sea level, erosion and sediment alter the shoreline. Comparing continental-shelf margins can provide a different geometric constraint. A hypothesis gains strength when it predicts independent patterns: rock ages, mountain belts, fossils and past-climate indicators should also agree when the proposed pieces are placed together. Attractive puzzle shapes alone do not supply the force or mechanism that moved them.
Read the visual model
The shapes are intentionally invented margin outlines. Their apparent fit suggests a comparison to test, rather than identifying actual continents.
What independent evidence would strengthen a proposed fit beyond outline similarity?
Visual reasoning — after your attempt
Matching dated rock sequences, mountain belts, fossil distributions with suitable ages/ecology and past-climate indicators can test the reconstruction. Modern motion measurements supply a further, different test.
Continental drift proposed that continents had changed position. Matching continental outlines suggested a question, but evidence included rock belts, fossil distributions and past-climate indicators. A strong hypothesis predicts several independent patterns; a visually appealing coastline fit alone is not a full test.
Compare continental shelves rather than modern beaches when evaluating a fit, because erosion and sea-level changes affect coastlines. Identify which features are measured and which former arrangement is inferred.
Pause and explain
Why is a shelf-edge comparison useful beyond the present shoreline?
Check your reasoning after answering
Present shorelines change with sea level and erosion; shelf geometry provides a different constraint on a proposed fit.
Part 2 · Fossils, rocks and climate indicators
A fossil distribution is more informative when the organisms’ habitats and the containing rocks’ ages are known. The same freshwater or terrestrial organism in comparably old strata on separated landmasses can challenge an explanation requiring it to cross a wide ocean. But similar appearance alone can lead to mistaken identification, and transport, dispersal or environmental differences may provide alternatives. Combine the fossil pattern with dated rocks and other indicators before proposing former connection. A fossil establishes a preserved occurrence, not a map of every place the organism once lived.
Read the visual model
Use the matching fossil symbols as one evidence layer. The supplied age relationship is crucial; the circles are tracking labels rather than real fossil drawings.
Would two matching-looking specimens from very different geological ages provide the same connection evidence?
Visual reasoning — after your attempt
No. Their identification, age ranges and ecology must be checked. Very different ages can reflect separate occurrences rather than the proposed simultaneous connected habitat.
Matching fossils in separated regions can support formerly connected habitats when organism ecology and rock ages are consistent. Mountain belts and rock sequences can add independent constraints. Glacial deposits record past conditions; their significance depends on reconstructing locations and comparing competing explanations.
One shared fossil does not prove every continent was joined at one time. Specify age, distribution, likely dispersal and the other evidence; several converging lines strengthen the reconstruction.
Pause and explain
What extra information makes a matching fossil distribution more informative?
Check your reasoning after answering
Comparable age, ecology/dispersal limits and consistent rock or geographic evidence.
Part 3 · Seafloor evidence supplies a mechanism test
Some iron-bearing minerals align with Earth’s magnetic field as molten rock cools. Once sufficiently cool, that magnetic remanence can preserve the field direction at formation. Field reversals over time therefore create alternating records as new crust forms near a ridge. Opposite sides can contain corresponding age and polarity sequences as they spread apart. These magnetic stripes are records of past conditions; they are not giant striped magnets driving the plates. Unequal spreading or later deformation can modify ideal symmetry.
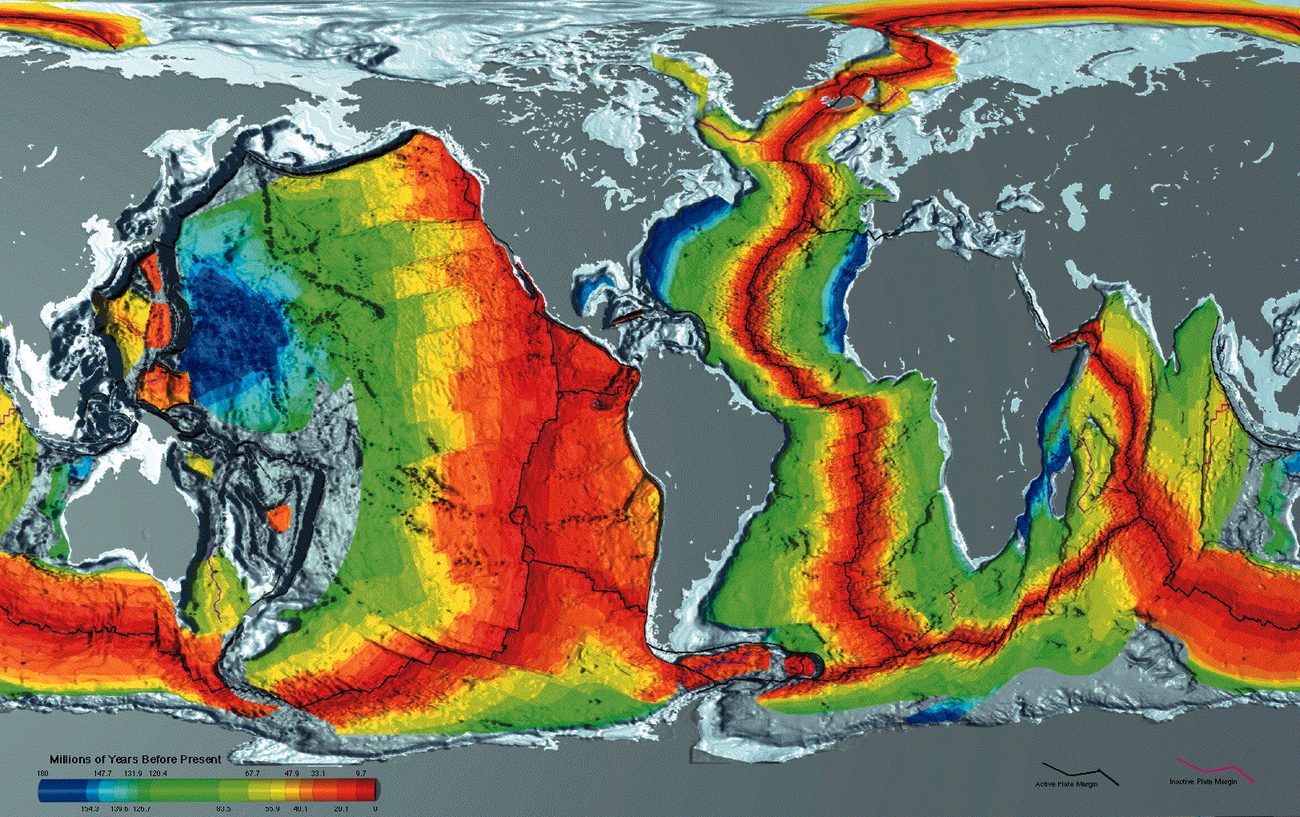
Read the visual model
Start at the ridge and compare successive bands moving outward on both sides. Color represents polarity record, not the literal visible color of ocean crust.
What two independent measurements would help test the spreading interpretation?
Visual reasoning — after your attempt
Compare dated crust ages with distance from the ridge and measure magnetic polarity patterns. Agreement of age trend and corresponding bands supports the model more than either alone.
Seafloor spreading connected new crust at ridges with older crust away from them. Alternating magnetic polarity bands can record field reversals as rock cools. Paired patterns and age trends support spreading; magnetic stripes are records of past fields, not giant magnets pulling continents apart.
If the same sequence occurs on both sides of a ridge, compare width and age as well as the polarity pattern. Unequal rates can complicate perfect visual symmetry without eliminating the underlying mechanism.
Pause and explain
What do magnetic stripes record, and what do they not directly cause?
Check your reasoning after answering
They record field polarity at cooling; they do not supply the force moving plates.
Part 4 · Scientific revision and present-day tests
Geodesy measures Earth’s shape, positions and movements. Repeated satellite-based position estimates can track station displacement over years. A supplied 10 cm eastward change in four years corresponds to 2.5 cm/year in the chosen reference frame. Extrapolating this rate through millions of years requires an assumption that direction and speed stayed unchanged, which may fail. Plate tectonics extended drift by connecting independent records to spreading, subduction and lithospheric motion. Scientific revision retains successful evidence while improving mechanisms and predictions.
Read the visual model
Read eastward displacement from an initial reference position. The curve is a selected constant-rate record, not a claim that every plate moves east.
Why can this four-year graph not determine the station’s location 100 million years ago by itself?
Visual reasoning — after your attempt
Rate and direction can change, and the station’s plate history may include deformation or boundary changes. Ancient positions require geological and paleomagnetic constraints as well as models.
A useful idea can explain some observations while lacking a satisfactory mechanism. Plate tectonics incorporated drift into a broader account of lithospheric motion, spreading and subduction. Modern measurements can test present movement, while geological evidence reconstructs past arrangements.
State what changed between the early drift proposal and plate tectonics. Scientific development involves new evidence and improved mechanisms, not only acceptance of a previously ignored conclusion.
Pause and explain
Why does evidence for present plate motion not determine every ancient position by itself?
Check your reasoning after answering
Past reconstruction also needs dated geological records and assumptions about how motion changed through time.
Apply the whole unit · Build a converging-evidence argument
Illustrative packet: two separated margins share dated rock belts and fossil assemblages; an intervening ridge has paired magnetic patterns and progressively older crust outward.
Your task
Construct an argument linking past connection and later spreading. Distinguish each observation from its inference and state a competing explanation that additional data could test.
What your response should show
- Use the supplied evidence accurately and label units or locations.
- Explain a physical mechanism or evidence-to-claim relationship.
- Show calculations or a clearly labeled model when the task calls for one.
- Identify a meaningful assumption, uncertainty, or competing explanation.
Response guidance — after your attempt
The margins’ dated matches support connection; seafloor records support subsequent spreading. Together they constrain a mechanism better than shape alone. Test ages, rock continuity and independent movement measurements; avoid assigning exact past positions without a reconstruction.
Scientific references and adapted source material
Parent / teacher teaching notes
Ask the learner to explain the force versus record distinction. Mark how evidence lines fit together, rather than reward a list of Wegener facts alone. Ask the learner to explain each visual label and causal step before calculating. Preserve a first model, attempt the changed independent case, then use feedback to revise. Diagrams state whether values are illustrative or observed. Selected OpenSciEd excerpts are middle-school source material used for supported foundations; the independent high-school explanations and supplements are not the complete OpenSciEd teacher editions or an endorsement.
The key idea
Matching fossils, rocks, coastlines, and climate clues showed that continents were once joined as Pangaea, and seafloor spreading later supplied the missing mechanism for how they drift apart.
Worked examples
Example 1
- Mesosaurus was a small freshwater reptile — it could not have swum across a vast, deep, salty ocean.
- Since the same fossil appears on both continents, those two landmasses must have been connected (or very close together) when Mesosaurus was alive.
- This supports continental drift: South America and Africa were once joined as part of Pangaea and have since drifted apart.
Example 2 · Worked application
- Shared fossils can support former connection when ages and organisms match.
- Matching rock belts or magnetic seafloor patterns provide independent evidence.
Similar appearance alone is weaker than dated, identified specimens.
Example 3
- Mountain ranges form as continuous belts of folded rock — if the pattern matches perfectly, the rock was likely folded as one continuous range.
- North America, Scotland, and Scandinavia are now separated by the Atlantic Ocean, so they cannot have formed this shared mountain belt in their current positions.
- This is best explained if these landmasses were once joined together (as part of Pangaea) when the mountain range originally formed, and later drifted apart, splitting the range between continents.
Example 4
- New crust can form at the ridge.
- As plates separate, older crust moves away symmetrically.
Example 5 · Find and fix the mistake
- Test the claim against the stated conditions: Similar appearance alone is weaker than dated, identified specimens.
- The fit is one clue; fossil, rock and seafloor evidence test the history and mechanism.
Similar appearance alone is weaker than dated, identified specimens.
Example 6 · Reason from the visual evidence
- Start at the ridge and compare successive bands moving outward on both sides. Color represents polarity record, not the literal visible color of ocean crust.
- Compare dated crust ages with distance from the ridge and measure magnetic polarity patterns. Agreement of age trend and corresponding bands supports the model more than either alone.
Original idealized magnetic-band model shows paired polarity records and an age trend away from a spreading center. Band widths are simplified and do not supply actual reversal durations. The central line is the ridge; stripes symbolize mineral records rather than physical forces.
Avoid these mistakes
- Matching coastlines alone are not the complete evidence for plate tectonics.
Check your understanding
Ocean-floor rocks are youngest at a ridge and older on both sides. What explanation fits?
Discuss the answer
Seafloor spreading fits the age pattern; magnetic stripes and plate-motion data provide additional tests.
Why are multiple independent kinds of evidence stronger than one suggestive match?
Discuss the answer
Independent fossil, rock, age, magnetic and motion records constrain different predictions and alternatives. Agreement across them is harder to explain as one accidental outline similarity.
Return to the phenomenon
Return to the initial case. What makes continental drift stronger than a puzzle-piece guess? Revise your drawing or explanation using two named ideas and one stated limitation.
Compare explanations after your attempt
Fossil ages/ecology, geological matches, magnetic records, seafloor ages and modern station motion provide independent tests. The combined plate model explains more than outlines alone.
What should we investigate next?
Which comparison would test a remaining uncertainty? State what you would change, keep comparable and measure.
Investigate, explain and revise
Complete the tasks after studying the visual parts. Keep the first model and explain a revision before consulting the guidance.
Activity 1 · Explain the opening case
Use this unit’s opening record, Parts 1–4 and your notebook model. No external equipment or text is required for this supplied-data route.
Your task
Return to the initial case. What makes continental drift stronger than a puzzle-piece guess? Revise your drawing or explanation using two named ideas and one stated limitation.
Success criteria
- Use two stated observations or conditions.
- Connect the mechanism to a labeled diagram or calculation.
- Identify what your original model missed.
- State a useful further test and a limitation.
Hint
Name the quantities and interactions before assigning a cause.
Response guidance — discuss after your attempt
Fossil ages/ecology, geological matches, magnetic records, seafloor ages and modern station motion provide independent tests. The combined plate model explains more than outlines alone.
Activity 2 · Transfer to a changed case
Use the figures, captions and vocabulary in this unit; cover the worked answer.
Your task
Oceanic crust is 80 km from a ridge and 4 million years old. Under steady symmetric spreading, find the half-spreading rate in cm/year and the full separation rate. State one independent check.
Success criteria
- Use the stated measurements or conditions, with correct units.
- Connect the result to the physical mechanism or evidence relationship.
- Identify the assumption, model limit or further evidence requested.
Hint
Separate measured values, calculated results and model assumptions.
Response guidance — discuss after your attempt
80/4 = 20 km per million years = 2 cm/year on one side; full symmetric separation is 4 cm/year. Check opposite-side age patterns and magnetic records; variable rates or asymmetric movement can challenge the assumption.
Words to know
- continental drift
- Alfred Wegener's idea that continents were once joined together and have since slowly moved to their current positions.
- Pangaea
- The single supercontinent that Wegener proposed all of today's continents were once joined together as, before it broke apart.
- seafloor spreading
- The process by which new ocean floor forms at mid-ocean ridges and spreads outward in both directions, providing the mechanism for continental drift.
- paleomagnetism
- Magnetic patterns frozen into ocean-floor rock as it cooled, recording the direction of Earth's magnetic field at the time — used as evidence for seafloor spreading.
The outsider whose idea was too good to accept — at first
Alfred Wegener wasn't even a geologist — he was a meteorologist and Arctic explorer, which made it easy for the geology establishment of his time to dismiss his 1912 continental drift hypothesis as an amateur's overreach. Prominent geologists mocked the idea for decades, in part because Wegener couldn't explain a physical mechanism. Wegener died in 1930 on a research expedition crossing the Greenland ice sheet, three decades before seafloor spreading would finally prove him right. His story is a classic example of how good evidence can still lose to entrenched scientific opinion — until a missing piece (a mechanism) finally falls into place.
Reading a 'fossil compass' frozen in rock
As lava cools and hardens, tiny grains of magnetic minerals inside it — like compass needles — lock into alignment with Earth's magnetic field at that exact moment, permanently recording its direction. By measuring this frozen paleomagnetism in rocks of different ages on the same continent, scientists can plot how Earth's magnetic pole appears to have 'wandered' over time — called an apparent polar wander path. When scientists compared these wander paths from different continents, they didn't match — unless the continents were shifted back into their ancient positions, providing independent proof that continents really had moved relative to each other.
The mapmaker who found the mountain range under the ocean
In the 1950s, geologist Marie Tharp painstakingly hand-plotted thousands of ocean-depth soundings and discovered a massive rift valley running down the center of a 40,000-mile-long underwater mountain chain — the mid-ocean ridge system. Her colleague Bruce Heezen initially dismissed her interpretation as 'girl talk,' but her map turned out to be exactly the evidence needed: Harry Hess used it to help propose seafloor spreading in 1962, showing that the ridges were where new crust constantly formed and split apart, finally giving continental drift the mechanism it had lacked for fifty years.
New York's bedrock remembers oceans that no longer exist
Long before the Atlantic Ocean opened, an older ocean called the Iapetus Ocean separated ancient versions of North America and Europe/Africa. The folded, faulted rock of the Taconic Mountains and Hudson Highlands records the slow closing of that ocean and the collision of landmasses hundreds of millions of years ago — one chapter in a longer story that also includes those same landmasses being joined into the supercontinent Rodinia, and later Pangaea, before rifting apart again into the continents and ocean we recognize today. New York's rocks are, in a sense, a diary of several complete Wilson Cycles.
In the real world
GPS stations glued to bedrock all over the world now track continents creeping along at a few centimeters a year — proof that the same slow drift Wegener proposed a century ago is still happening under your feet today.
Exit check
Give two independent observations supporting moving continents and explain why two help.
Check your explanation after answering
Matching fossils or rock belts across oceans and the seafloor age/magnetic pattern support former connections and later motion. Independent lines reduce reliance on a single ambiguous observation.
Explain your reasoning without notes. If a key idea is missing, revisit the lesson and try again.
Earthquake Evidence & Hazard Risk
Learning goals
- I can use seismic observations to constrain an earthquake’s location.
- I can distinguish a natural hazard from the risk to people and buildings.
Readings for this unit
Before this unit
Read earthquake travel-time differences and population data.
Plan three teaching sessions: core explanation and Parts 1–2; Parts 3–4 with diagrams and reasoning checks; then the whole-unit application, worked examples, independent practice, and exit check. Read one part at a time, explain it without notes, and revisit any gap. Allow about 40–50 minutes per session; adjust after checking understanding. Trace and explain the labeled figures in each part. In the third session, complete the illustrated case and changed independent application; retain a corrected explanation rather than only an answer.
Start with something to explain
Can we reduce earthquake consequences without stopping earthquakes?
Illustrative evidence case. A supplied consequence model falls after buildings are strengthened, although the same fault-event assumptions are used.
Notice and wonder
Record two observations using the stated quantities or relationships. Keep observations separate from possible causes. Write one question that a new measurement could help answer.
Can we reduce earthquake consequences without stopping earthquakes?
Your first model
Separate physical event, exposed assets and susceptibility in a cause-and-consequence diagram.
Build the language from the idea
- epicenter
- The surface location above an earthquake’s focus.
- intensity
- The shaking effects experienced at a location.
- vulnerability
- How susceptible a population or structure is to damage.
P waves and S waves travel at different speeds. At a station, a larger S–P arrival-time gap generally indicates a greater distance from the source, using an appropriate travel-time model. A single station constrains distance rather than a unique direction. Combining observations from several stations narrows the possible location.
Magnitude describes an earthquake’s size from seismic measurements; intensity describes shaking effects at a particular place. Distance, local ground materials, depth, and building design influence damage. A larger magnitude does not guarantee greater damage at every location. Do not confuse the roughly tenfold amplitude step of a magnitude scale with the larger energy ratio.
A hazard is a potentially damaging process. Risk also depends on exposure and vulnerability: who or what is there and how susceptible they are. Historical patterns can inform probabilities over time, but they do not provide an exact date for the next earthquake. Engineering can reduce losses without eliminating the underlying tectonic process.
Hazard describes a potentially damaging event; risk combines its likelihood with exposure and vulnerability. Two places with similar shaking hazards can have different risks if one has many more people or weaker buildings. Keep these categories separate when comparing sites.
A map showing past earthquakes does not establish when the next one will occur. Historical records are incomplete, and a fault's recurrence pattern varies. Combine geologic evidence, instrumental measurements and building information in a risk assessment.
Evaluate a mitigation by what it changes. Reinforcing a building reduces vulnerability but does not stop plate motion. A warning system can give limited time to act after detection, while emergency planning improves response. State the limits as well as the expected benefit.
Build your understanding
Plan three teaching sessions: core explanation and Parts 1–2; Parts 3–4 with diagrams and reasoning checks; then the whole-unit application, worked examples, independent practice, and exit check. Read one part at a time, explain it without notes, and revisit any gap. Allow about 40–50 minutes per session; adjust after checking understanding.
Part 1 · Locate an event using travel-time models
A station’s S–P gap can be converted to an approximate source distance using an appropriate travel-time relation. On a simplified local map, draw a distance circle around that station. One circle admits many directions; a second reduces possible positions; a third helps distinguish them. Actual distances have uncertainty, so real constraints are bands or regions rather than perfectly intersecting thin lines. Earth curvature, variable wave speeds and timing can require more sophisticated location methods. A plotted overlap is an estimate, not the complete rupture footprint.
Read the visual model
The station dots are the circle centers. The red point marks the common location in this ideal geometry; the circles encode supplied distances.
Why does a single accurately timed station not determine a unique epicenter?
Visual reasoning — after your attempt
Its inferred distance admits many points around the station without unique direction. Additional station constraints and an appropriate Earth model are needed.
An S–P arrival-time gap is related to distance through a travel-time model. One station gives an approximate distance, which corresponds to possible locations around it rather than a unique direction. Several stations can narrow the location; timing errors and three-dimensional velocity differences affect the result.
On a classroom map, use the supplied model to find distances, draw circles around stations, and identify their overlap. Circle intersections illustrate a simplified epicenter method, not a complete operational earthquake-location calculation.
Pause and explain
Why does one station fail to identify a unique epicenter?
Check your reasoning after answering
Distance alone leaves multiple directions; additional station observations constrain location.
Part 2 · Separate hazard, exposure and vulnerability
Hazard refers to a potentially damaging event or process. Exposure identifies people or assets in the affected area. Vulnerability describes susceptibility to harm under those conditions. Risk assessment connects these factors with likelihood and consequences; they do not share a universal common unit. Strengthening buildings can lower vulnerability without changing the fault’s chance of slipping. Relocating an asset can change exposure. Comparing interventions therefore requires naming which part of the risk chain each intervention affects and checking local evidence.
Read the visual model
The bars illustrate distinct indices and must not be added. Their visual lengths do not give a monetary loss forecast.
Would lowering the building-vulnerability index prove that the local earthquake hazard has fallen?
Visual reasoning — after your attempt
No. It can reduce expected consequences for those structures while the underlying fault hazard remains. Hazard, exposure and vulnerability must be distinguished.
Hazard concerns potentially damaging physical events. Exposure describes people or assets in the affected area. Vulnerability concerns how susceptible they are to damage. Risk depends on their interaction; low population exposure and strong construction can change consequences without changing the fault’s physical hazard.
Two sites near the same fault can have different expected loss because one has vulnerable buildings and more exposed occupants. Identify which variable a proposed intervention changes.
Pause and explain
Does strengthening a building stop the fault from slipping?
Check your reasoning after answering
No. It aims to reduce vulnerability and consequences rather than eliminate the seismic hazard.
Part 3 · Evaluate probabilities and monitoring claims
A probability statement needs a specified event threshold, geographical region and interval. A 30-year estimate cannot be read as a prediction of the day on which an earthquake will occur, nor directly compared with a one-year estimate without its model. Earthquake early warning uses detection of a rupture that has already begun, then communicates before some later shaking arrives at more distant places. Its available lead time depends on distance and processing; it may be very short near the source. These are different kinds of information and decisions.
Read the visual model
Read the chronological arrows as detection followed by later shaking at a selected distant place. This is not a guaranteed advance prediction.
Why does early warning not demonstrate an ability to name the exact earthquake date before rupture?
Visual reasoning — after your attempt
Warning follows detection of an event already underway. Exact-date prediction before rupture is a different and unsupported claim in this model.
A long-term probability concerns a defined event, area and time interval. It does not identify the exact day, and it is not equivalent to a certainty that no event occurs outside the interval. Examine the basis and uncertainty of an estimate before comparing places or recommending a policy.
A statement of a 20% chance over a specified period leaves both occurrence and nonoccurrence possible. Ask what magnitude range, location and time are intended; a number without those definitions is incomplete.
Pause and explain
Why are probabilities for different time windows not directly interchangeable?
Check your reasoning after answering
Longer and shorter windows describe different event opportunities; the same percentage has a different meaning.
Part 4 · Use evidence to compare mitigation options
Mitigation reduces potential harm before a damaging outcome. A proposal might strengthen structures, reduce exposure, improve monitoring or prepare a response. To compare options, use the same event assumptions, population or asset boundary and consequence measure. Costs and maintenance can change feasibility, while who benefits and who bears a cost can change priorities. An illustrative lower loss index is evidence within its model, not proof that damage has become impossible. State what monitoring would reveal whether the intervention is performing as intended.
Read the visual model
Follow the consequence index under matched hazard assumptions. The bars compare supplied outcomes, not fault-slip rates.
Which option has the lowest supplied consequence index, and what is still needed before recommending it?
Visual reasoning — after your attempt
The combined option has index 25, but costs, feasibility, maintenance, impacts on affected groups and uncertainty must be compared before a defensible decision.
Mitigation choices can reduce exposure or vulnerability, improve detection, or support response. Define a measurable objective and compare costs, maintenance and groups affected. An early warning based on a detected earthquake is different from forecasting the event before it begins.
A monitoring system may provide useful warning after rupture starts, depending on distance and communication. It cannot be credited with preventing earthquakes; identify its actual function and limits.
Pause and explain
How does earthquake early warning differ from an exact advance prediction?
Check your reasoning after answering
It detects an event already beginning and may warn before strong shaking reaches some locations.
Apply the whole unit · A school-site risk comparison
Illustrative case: Site A is nearer a fault but has lower exposure and upgraded structures. Site B is farther away, has soft sediment, crowded use and vulnerable structures.
Your task
Explain why distance alone cannot rank overall risk, identify data needed for a fair comparison, and evaluate a mitigation that changes vulnerability.
What your response should show
- Use the supplied evidence accurately and label units or locations.
- Explain a physical mechanism or evidence-to-claim relationship.
- Show calculations or a clearly labeled model when the task calls for one.
- Identify a meaningful assumption, uncertainty, or competing explanation.
Response guidance — after your attempt
Compare expected shaking, site response, occupancy and structural susceptibility. Distance is one input; strengthening vulnerable structures can reduce consequences without changing fault motion. No quantitative risk ranking follows from the supplied qualitative details alone.
Scientific references and adapted source material
Parent / teacher teaching notes
Require a hazard/exposure/vulnerability distinction in the learner’s own words. Use supplied cases for reasoning; direct actual local decisions to appropriate official evidence and professionals. Ask the learner to explain each visual label and causal step before calculating. Preserve a first model, attempt the changed independent case, then use feedback to revise. Diagrams state whether values are illustrative or observed. Selected OpenSciEd excerpts are middle-school source material used for supported foundations; the independent high-school explanations and supplements are not the complete OpenSciEd teacher editions or an endorsement.
The key idea
Seismic evidence constrains location; hazard, exposure, and vulnerability together shape risk.
Worked examples
Example 1
- Distance is only one factor.
- Ground response and building vulnerability differ.
Example 2 · Worked application
- Hazard describes the physical event potential.
- Exposure and vulnerability affect harm, so building differences can change risk under similar hazard.
Separate event likelihood from likely consequences.
Example 3
- Hazard is comparable, but exposure and vulnerability differ.
- The crowded weak buildings increase the potential consequences.
Example 4 · Find and fix the mistake
- Test the claim against the stated conditions: Separate event likelihood from likely consequences.
- Distance, depth, soils, building design and exposure also affect damage.
Separate event likelihood from likely consequences.
Example 5 · Reason from the visual evidence
- Read the chronological arrows as detection followed by later shaking at a selected distant place. This is not a guaranteed advance prediction.
- Warning follows detection of an event already underway. Exact-date prediction before rupture is a different and unsupported claim in this model.
Original conceptual distinction between defined-interval probabilities and detected-event warning. The diagram supplies no actual hazard probability, geographic warning range or guaranteed seconds of lead time. Use official local information for operational safety decisions.
Avoid these mistakes
- An exact earthquake time cannot be inferred from a simple average recurrence interval.
Check your understanding
Two towns have similar hazard; one has weak crowded buildings and the other reinforced sparse buildings. Compare risk.
Discuss the answer
The first town plausibly has higher risk; a numerical estimate needs more detailed evidence.
How does reinforcing a building change risk without changing hazard?
Discuss the answer
Reinforcement can lower vulnerability of exposed structures while the physical fault hazard remains. Consequences can change without stopping plate motion or fault slip.
Return to the phenomenon
Return to the initial case. Can we reduce earthquake consequences without stopping earthquakes? Revise your drawing or explanation using two named ideas and one stated limitation.
Compare explanations after your attempt
Mitigation can reduce vulnerability or exposure without stopping a fault from slipping. Location and monitoring require evidence with uncertainty; exact-date forecasts are not implied.
What should we investigate next?
Which comparison would test a remaining uncertainty? State what you would change, keep comparable and measure.
Investigate, explain and revise
Complete the tasks after studying the visual parts. Keep the first model and explain a revision before consulting the guidance.
Activity 1 · Explain the opening case
Use this unit’s opening record, Parts 1–4 and your notebook model. No external equipment or text is required for this supplied-data route.
Your task
Return to the initial case. Can we reduce earthquake consequences without stopping earthquakes? Revise your drawing or explanation using two named ideas and one stated limitation.
Success criteria
- Use two stated observations or conditions.
- Connect the mechanism to a labeled diagram or calculation.
- Identify what your original model missed.
- State a useful further test and a limitation.
Hint
Name the quantities and interactions before assigning a cause.
Response guidance — discuss after your attempt
Mitigation can reduce vulnerability or exposure without stopping a fault from slipping. Location and monitoring require evidence with uncertainty; exact-date forecasts are not implied.
Activity 2 · Transfer to a changed case
Use the figures, captions and vocabulary in this unit; cover the worked answer.
Your task
One station gives a modeled epicenter distance of 120 km. A proposed building retrofit lowers susceptibility to shaking. Explain what the distance constrains and which risk component the retrofit changes.
Success criteria
- Use the stated measurements or conditions, with correct units.
- Connect the result to the physical mechanism or evidence relationship.
- Identify the assumption, model limit or further evidence requested.
Hint
Separate measured values, calculated results and model assumptions.
Response guidance — discuss after your attempt
The distance defines an approximate set of possible source locations around the station, not a unique direction. The retrofit changes vulnerability, while local physical hazard is not necessarily changed. Additional stations and verified building-performance evidence are needed.
Words to know
- epicenter
- The surface location above an earthquake’s focus.
- intensity
- The shaking effects experienced at a location.
- vulnerability
- How susceptible a population or structure is to damage.
In the real world
Exit check
A new school is proposed near an active fault. What evidence should the decision consider besides earthquake magnitude?
Check your explanation after answering
Expected local shaking, site geology, exposure, structural vulnerability, access, and mitigation options, with uncertainties.
Explain your reasoning without notes. If a key idea is missing, revisit the lesson and try again.
Problem 1
Answer and explanation
Crust, mantle, outer core, inner core.
Starting at the surface and going down: the crust (thin and rocky), then the mantle (a thick layer of hot, slow-flowing rock), then the liquid outer core (iron and nickel), then the solid inner core (iron and nickel) at the very center.
Problem 2
Answer and explanation
The crust and the uppermost part of the mantle.
The lithosphere is defined by physical property (rigid and brittle), not composition, and it includes the crust plus the very top of the mantle, all riding together as one rigid shell broken into tectonic plates.
Problem 3
Answer and explanation
3,420 km combined; about 50% of Earth's radius.
Add the two thicknesses: 2,200 + 1,220 = 3,420 km. Divide by Earth's radius: 3,420 ÷ 6,371 ≈ 0.537, or about 54%, which rounds to the nearest 10% as about 50% — roughly half of Earth's radius.
Problem 4
Answer and explanation
The immense pressure at Earth's center keeps the iron-nickel atoms packed too tightly to flow, even at extreme temperature.
Whether iron stays solid or turns liquid depends on both temperature and pressure, not temperature alone. The inner core is indeed hotter than the outer core, but the pressure from the entire weight of the planet pressing down on it is so enormous that it forces the iron and nickel atoms to stay locked in a solid structure, unable to flow the way the less-pressurized outer core can.
Problem 5
Answer and explanation
They move apart; example: the Mid-Atlantic Ridge (or the East African Rift).
Divergent boundaries pull plates apart, letting magma rise up to form new crust. The Mid-Atlantic Ridge, where the ocean floor is spreading and slowly widening the Atlantic Ocean, is a classic example.
Problem 6
Answer and explanation
A volcanic island arc, such as Japan.
When two oceanic plates converge, the denser one subducts beneath the other, melts, and feeds a curving chain of volcanoes that rises up out of the ocean as a volcanic island arc — Japan is a well-known example.
Problem 7
Answer and explanation
Neither continental plate is dense enough to subduct, so the crust crumples and folds upward into mountains instead of melting into magma.
Subduction (and the volcanoes it feeds) only happens when one plate is dense enough to sink beneath the other. Continental crust is too light on both sides, so instead of sinking, the colliding edges buckle and fold upward, building mountain ranges like the Himalayas with little to no volcanic activity.
Problem 8
Answer and explanation
About 1,000 times more ground-shaking.
Each whole number on the magnitude scale represents about 10× more shaking. From magnitude 4 to 7 is three steps, so 10 × 10 × 10 = 1,000 times more shaking.
Problem 9
Answer and explanation
The station with the 6-minute gap is farther from the epicenter.
P-waves always travel faster than S-waves, so the gap between their arrival times grows the farther the waves travel. A bigger gap (6 minutes) means the waves traveled a longer distance, so that station is farther from the epicenter than the one with only a 1-minute gap.
Problem 10
Answer and explanation
A hot spot — a stationary plume of hot mantle rock melts through the crust while the plate slowly slides over it, leaving a trail of progressively older volcanoes.
This pattern is the signature of a hot spot: a plume of unusually hot rock rises from deep in the mantle and stays in roughly the same place while the tectonic plate above it slowly slides across. Each time the plate shifts, the hot spot burns through a new spot in the crust, building a fresh volcano, while the older volcanoes are carried away from the hot spot and gradually go extinct — creating a chain that gets older with distance from the currently active volcano, just like the Hawaiian Island chain.
Problem 11
Answer and explanation
It suggests those continents were once joined together, since Glossopteris could not have spread its seeds across a vast ocean.
Glossopteris was a land plant with seeds too heavy to be carried across entire oceans by wind or water. Finding its fossils on continents that are now far apart only makes sense if those continents were once connected, allowing the plant to spread across a single connected landmass before the continents drifted apart.
Problem 12
Answer and explanation
Wegener had no mechanism for how continents could move; seafloor spreading and paleomagnetic stripes discovered in the 1960s provided that mechanism.
Wegener could show strong evidence that continents had once been joined, but he could not explain a physical process powerful enough to push solid continents through solid ocean floor, so most scientists dismissed the idea. That changed in the 1960s, when scientists discovered seafloor spreading at mid-ocean ridges, confirmed by symmetric stripes of paleomagnetism recorded in the ocean floor rock — finally giving continental drift, as part of plate tectonics, a real mechanism.
Problem 13
- a solid inner core
- a liquid outer core
- a thin crust
- a uniform Earth
Answer and explanation
a liquid outer core
S-waves cannot cross liquid, so their absence marks a liquid layer.
Problem 14
Answer and explanation
The crust is about half a percent of Earth's radius, so at true scale it would be a line barely thicker than the ink, and the mantle would dominate the picture. Textbook diagrams exaggerate the crust so its features can be labelled, which is useful but gives a misleading impression of how thin it actually is.
Response criteria
- State a scientifically accurate conclusion.
- Show the data, mechanism, or calculation that supports it.
- Include units, conditions, or limits where relevant.
Problem 15
Answer and explanation
Lithosphere is a mechanical layer including crust and rigid uppermost mantle, so it overlaps compositional categories. Most mantle is solid and can deform slowly under sustained stress; convection does not establish liquid state.
Lithosphere is a mechanical layer including crust and rigid uppermost mantle, so it overlaps compositional categories. Most mantle is solid and can deform slowly under sustained stress; convection does not establish liquid state.
Response criteria
- Use the stated measurements or conditions, with correct units.
- Connect the result to the physical mechanism or evidence relationship.
- Identify the assumption, model limit or further evidence requested.
Problem 16
- a divergent boundary
- a subduction zone
- a transform fault
- a hotspot
Answer and explanation
a subduction zone
The trench marks where the descending plate bends downward.
Problem 17
Answer and explanation
Both result from the interaction of plates, and those interactions happen at plate edges rather than across plate interiors. Mapping earthquake and volcano locations therefore traces the boundaries themselves, which is one of the strongest lines of evidence that the surface is divided into moving plates.
Response criteria
- State a scientifically accurate conclusion.
- Show the data, mechanism, or calculation that supports it.
- Include units, conditions, or limits where relevant.
Problem 18
Answer and explanation
The gap closes at 6−2 = 4 cm/year. Relative convergence is established, but plate types, trench geometry, earthquake depths and geological evidence are needed to distinguish subduction from other convergent settings.
The gap closes at 6−2 = 4 cm/year. Relative convergence is established, but plate types, trench geometry, earthquake depths and geological evidence are needed to distinguish subduction from other convergent settings.
Response criteria
- Use the stated measurements or conditions, with correct units.
- Connect the result to the physical mechanism or evidence relationship.
- Identify the assumption, model limit or further evidence requested.
Problem 19
Answer and explanation
100
Each unit is a tenfold amplitude increase, so two units is 10 × 10 = 100 times.
Problem 20
Answer and explanation
P-waves travel faster than the slower, more damaging S-waves and surface waves, so detecting the P-wave arrival near the source gives a short interval — seconds to tens of seconds — before the strong shaking reaches a more distant place. That interval is enough to stop trains and shut valves, though not to evacuate, and it shrinks to nothing close to the epicentre.
Response criteria
- State a scientifically accurate conclusion.
- Show the data, mechanism, or calculation that supports it.
- Include units, conditions, or limits where relevant.
Problem 21
Answer and explanation
The S–P gap is 36 s. Distance inference needs the appropriate travel-time model; direction requires other stations. Damage also depends on local intensity, depth, ground and structures, so one gap or surface location is insufficient.
The S–P gap is 36 s. Distance inference needs the appropriate travel-time model; direction requires other stations. Damage also depends on local intensity, depth, ground and structures, so one gap or surface location is insufficient.
Response criteria
- Use the stated measurements or conditions, with correct units.
- Connect the result to the physical mechanism or evidence relationship.
- Identify the assumption, model limit or further evidence requested.
Problem 22
Answer and explanation
Matching fossils and rock sequences across oceans, symmetric magnetic stripes with ages increasing away from mid-ocean ridges, and present-day plate velocities measured by satellite positioning. Each could be questioned alone — fossils by land bridges, for instance — but they come from different fields with different weaknesses, and a single alternative would have to explain all three at once, which is what makes the conclusion secure.
Response criteria
- State a scientifically accurate conclusion.
- Show the data, mechanism, or calculation that supports it.
- Include units, conditions, or limits where relevant.
Problem 23
Answer and explanation
20 m
2 × 1,000 = 2,000 cm = 20 m.
Problem 24
Answer and explanation
80/4 = 20 km per million years = 2 cm/year on one side; full symmetric separation is 4 cm/year. Check opposite-side age patterns and magnetic records; variable rates or asymmetric movement can challenge the assumption.
80/4 = 20 km per million years = 2 cm/year on one side; full symmetric separation is 4 cm/year. Check opposite-side age patterns and magnetic records; variable rates or asymmetric movement can challenge the assumption.
Response criteria
- Use the stated measurements or conditions, with correct units.
- Connect the result to the physical mechanism or evidence relationship.
- Identify the assumption, model limit or further evidence requested.
Problem 25
Answer and explanation
A location estimate with uncertainty; travel-time models and measurements are not exact. Additional stations may narrow the region.
Problem 26
Answer and explanation
The distance defines an approximate set of possible source locations around the station, not a unique direction. The retrofit changes vulnerability, while local physical hazard is not necessarily changed. Additional stations and verified building-performance evidence are needed.
The distance defines an approximate set of possible source locations around the station, not a unique direction. The retrofit changes vulnerability, while local physical hazard is not necessarily changed. Additional stations and verified building-performance evidence are needed.
Response criteria
- Use the stated measurements or conditions, with correct units.
- Connect the result to the physical mechanism or evidence relationship.
- Identify the assumption, model limit or further evidence requested.