The Water Cycle — Print · Grade 9 Science
Chapter: Atmosphere & WeatherThe Water Cycle
Learning goals
- I can name the major processes of the water cycle and put them in order.
- I can explain which force — the sun's energy or gravity — drives each step of the cycle.
Readings for this unit
Before this unit
Identify water's phases and changes of state.
Plan three teaching sessions: core explanation and Parts 1–2; Parts 3–4 with diagrams and reasoning checks; then the whole-unit application, worked examples, independent practice, and exit check. Read one part at a time, explain it without notes, and revisit any gap. Allow about 40–50 minutes per session; adjust after checking understanding. Trace and explain the labeled figures in each part. In the third session, complete the illustrated case and changed independent application; retain a corrected explanation rather than only an answer.
Start with something to explain
Why does the same rain not produce the same stream or lake response?
Illustrative evidence case. A short test partitions 100 mL of rain into runoff, infiltration and storage. A lake receives and loses water at separate rates.
Notice and wonder
Record two observations using the stated quantities or relationships. Keep observations separate from possible causes. Write one question that a new measurement could help answer.
Why does the same rain not produce the same stream or lake response?
Your first model
Draw reservoirs and labeled transfers; keep a store separate from a daily rate.
Build the language from the idea
- evaporation
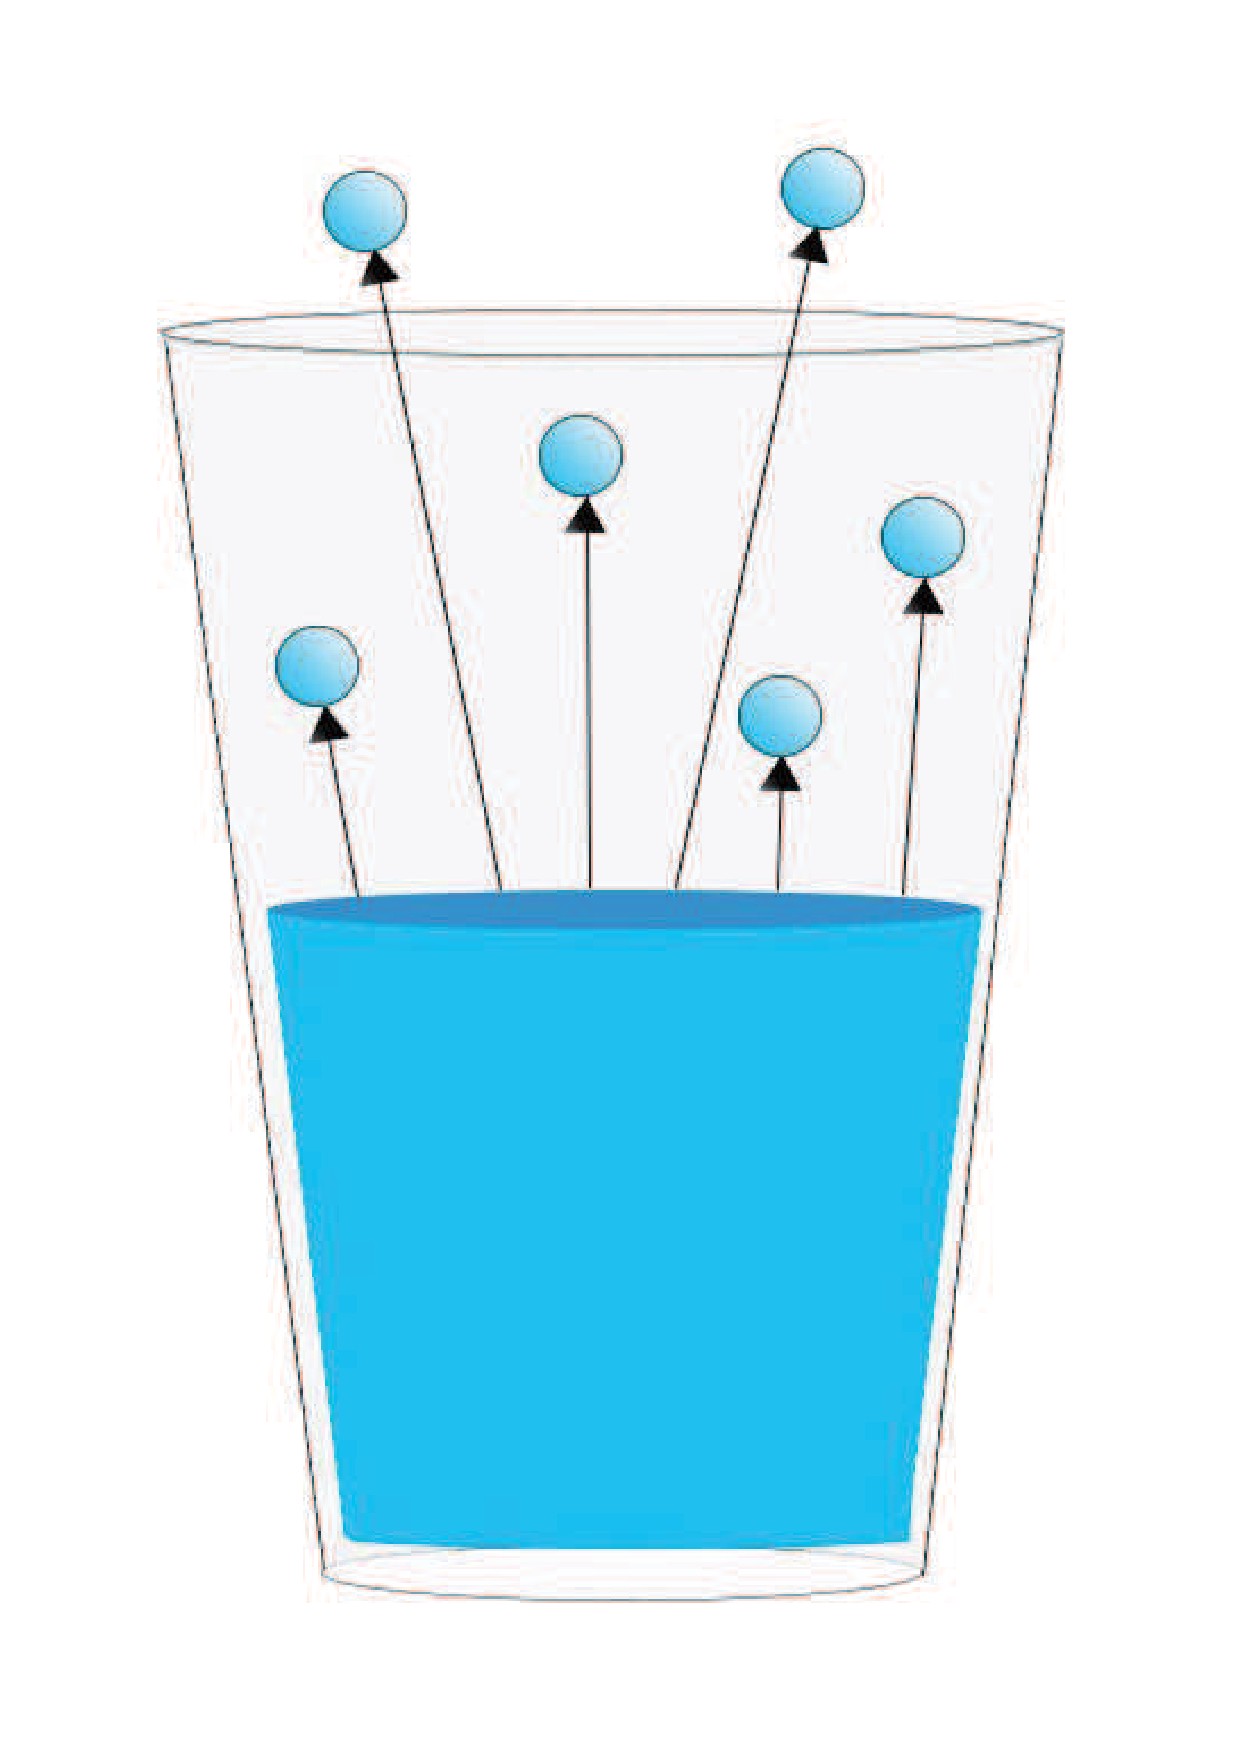
- The change of liquid water into water vapor, powered by energy from the sun, mostly from the surface of oceans.
- condensation
- The change of water vapor into tiny liquid droplets as rising air cools, forming clouds.
- precipitation
- Water falling back to Earth's surface as rain, snow, sleet, or hail once droplets or ice crystals grow heavy enough.
- transpiration
- The release of water vapor from tiny openings in plant leaves; combined with evaporation, it's called evapotranspiration.
Every drop of water on Earth is a hand-me-down, recycled countless times over billions of years — the water you drank today may once have swirled in an ancient sea or drifted in a cloud over a dinosaur's head. The water cycle is the great loop that keeps moving that same fixed supply of water among the oceans, the sky, and the land. It usually starts with evaporation: the sun's energy heats liquid water, mostly at the wide surface of the oceans, giving the fastest-moving water molecules enough energy to break free and float up into the air as invisible water vapor. Plants add to the supply too, releasing water vapor through tiny pores in their leaves in a process called transpiration — combine the two and scientists call it evapotranspiration.
Rising air can expand and cool. At lower temperature, the saturation vapor pressure is lower; cooling a moist parcel can therefore bring it toward saturation without adding water vapor. Condensation produces tiny liquid droplets, and under suitable conditions ice crystals can also form. Visible clouds consist of these condensed particles; water vapor itself is invisible. Air does not act as a literal container that holds water. Condensation on a cold mirror or glass illustrates how cooling near a surface can change vapor into liquid.
Inside a cloud, droplets keep colliding and merging until some grow too heavy for the air to hold up — and gravity takes over, pulling them back to Earth as precipitation: rain, snow, sleet, or hail, depending on the temperatures they fall through. (Water can occasionally skip the liquid stage entirely: snow and ice sometimes turn straight into vapor through a bonus process called sublimation.) Which form falls where, and when, is a big part of what we experience as day-to-day weather.
Once precipitation reaches the ground, it splits up. Some soaks down into the soil and rock to become groundwater, and the rest becomes runoff, sliding downhill over the land into streams, rivers, and lakes and eventually back to the ocean — where it's ready to evaporate and start the whole trip over. Step back and you'll see the cycle runs on just two engines pulling in opposite directions: the sun's energy lifts water upward (through evaporation and transpiration), and gravity pulls it back down (through precipitation and runoff). Sun up, gravity down, over and over, without end.
It's worth knowing where all that water actually sits at any one moment. About 97 percent of Earth's water is salty ocean, and of the small freshwater slice that's left, most is frozen in ice sheets and glaciers or hidden underground — only a tiny fraction is the liquid surface water in lakes and rivers that living things depend on. That's why the water cycle isn't just a diagram to memorize: it's the system that refills the freshwater we drink, waters the crops we eat, and links a single rainy afternoon to the long-term climate patterns of an entire region.
Water moves among atmosphere, surface, living organisms and underground stores. Solar energy supports evaporation and atmospheric circulation; gravity supports precipitation and runoff. A water-cycle diagram should include stores as well as arrows.
Evaporation and transpiration return water to the atmosphere. Condensation requires cooling or other conditions that allow vapor to become liquid droplets. Clouds contain tiny droplets or ice, not merely invisible water vapor.
Residence times differ: water can pass quickly through a stream or remain much longer in ice or groundwater. Human withdrawals change flows without creating or destroying water. Use a defined region and interval when applying a water budget.
Build your understanding
Plan three teaching sessions: core explanation and Parts 1–2; Parts 3–4 with diagrams and reasoning checks; then the whole-unit application, worked examples, independent practice, and exit check. Read one part at a time, explain it without notes, and revisit any gap. Allow about 40–50 minutes per session; adjust after checking understanding.
Part 1 · Distinguish reservoirs from transfers
A reservoir is a store, such as a lake, glacier, soil, atmosphere or groundwater. A flux is a transfer rate, such as cubic metres per day entering a lake. A 1,000 m³ lake store and 50 m³/day inflow are different kinds of quantity; over four days that inflow supplies 200 m³ before outflows are considered. Water can follow repeated or alternate paths, so the water cycle is not one itinerary every molecule completes in order. Specify which store and interval are being described before comparing turnover or constructing a balance.
Read the visual model
Read cloud, surface water and ground as selected stores; read arrows as processes moving water. Reservoir pictures are not drawn to their actual volume ratios.
Can 1,000 m³ and 50 m³/day be added directly to get a new lake volume?
Visual reasoning — after your attempt
No. Convert the transfer rate over a specified time and account for outputs. Four days of that inflow provide 200 m³, not 50 m³ as a permanent addition independent of time.
A reservoir stores water; a flux transfers it at a rate. Oceans, glaciers, groundwater and the atmosphere have different sizes and turnover times. The water cycle is a network rather than a single sequence every molecule follows. Define the reservoir and interval before comparing storage and flow quantities.
A lake holding 1,000 m³ and receiving 100 m³ per day has a storage and an input rate with different units. An actual residence-time estimate also needs outflows, mixing and assumptions.
Pause and explain
Why can reservoir volume and daily flow not be added directly?
Check your reasoning after answering
They measure different quantities; a rate must be integrated over an interval to obtain a transferred volume.
Part 2 · Connect phase changes to energy
Evaporation takes molecules from liquid into vapor at a surface; the process requires energy and can cool the liquid or its surroundings. Condensation returns vapor molecules to liquid droplets and releases energy. Water vapor is the gas phase and is invisible; the visible cloud consists of tiny droplets or ice crystals rather than just invisible vapor. Latent energy is energy associated with a phase change that need not appear as a temperature rise during the change itself. Keep the material pathway separate from the energy transfer when drawing the model.
Read the visual model
Blue arrows track water-phase transfer; red arrows track energy direction for the selected process. They have different meanings and units.
Why is a visible cloud not simply a collection of invisible water-vapor molecules?
Visual reasoning — after your attempt
Visible cloud material is condensed droplets or ice. Vapor participates in their formation but is not itself the visible droplet/ice phase.
Evaporation transfers liquid molecules into vapor and takes energy from the surroundings; condensation releases energy as vapor becomes liquid. Freezing, melting and sublimation involve other state changes. Water vapor is invisible; visible cloud droplets or ice are condensed material. Identify both material transfer and energy transfer.
A cool surface can collect condensed water from moist air. The droplets are not created from nothing or squeezed out of dry material; explain the source of vapor and cooling conditions.
Pause and explain
Are visible clouds composed only of invisible water vapor?
Check your reasoning after answering
No. Their visible portions consist of tiny liquid droplets and/or ice crystals.
Part 3 · Explain precipitation and surface pathways
Precipitation is water falling from clouds as droplets or ice particles that have grown large enough to reach the surface under the conditions. Once on land, water can run off, enter the ground, collect temporarily or be taken up and later returned through plants. Transpiration is water loss to air from plants. Cover, slope, soil, rainfall rate and previous saturation influence how input partitions. A 100 mL input can yield only 35 mL of surface runoff while the remainder occupies other terms. Low runoff does not by itself mean missing water or no later groundwater discharge.
Read the visual model
Account for all the stated pathways over the same test interval. The bars are volumes rather than rates; the example neglects evaporation during the short test.
If runoff becomes 55 mL and surface storage stays 20 mL with the same 100 mL input, what infiltration remains under the stated model?
Visual reasoning — after your attempt
25 mL, because 100−55−20 = 25. The calculation assumes all relevant transfers and stores have been included over the matched interval.
Air can cool to conditions permitting condensation, but precipitation also requires droplets or crystals to grow enough to fall. After reaching land, water can run off, infiltrate, be stored or be taken up by organisms and later transpired. Slope, soil, cover and rainfall intensity affect the partition.
A paved and a vegetated surface receiving equal rain may produce different runoff. The difference does not mean the missing runoff disappeared; investigate infiltration, storage and evapotranspiration.
Pause and explain
Why can equal rainfall produce different runoff volumes?
Check your reasoning after answering
Different surface and subsurface conditions divide water among pathways differently.
Part 4 · Balance a reservoir across time
For the stated lake, inflow 50 m³/day minus total outflow 30 m³/day produces a net gain of 20 m³/day. Beginning at 400 m³, the model reaches 460 m³ after three days. A measured rise could result from greater inflow, smaller outflow or some combination, so a storage series alone does not uniquely identify a cause. Water level and storage volume also differ: converting volume change to height requires the lake’s area/shape relationship. A broad shallow lake and narrow basin can have different level changes for the same volume addition.
Read the visual model
The vertical axis measures storage volume, not height above sea level. Use the net transfer rate over the shown time.
Would a 60 m³ gain imply a 60 m rise in lake level? What else is needed?
Visual reasoning — after your attempt
No. Volume and height have different units. The lake’s geometry or volume-level relation is needed to convert the 60 m³ gain into a level change.
For a stated lake or catchment, changes in storage follow inputs minus outputs. Compare consistent units and time intervals. A rising water level does not by itself identify which input changed; level also depends on reservoir geometry and outflows. Use a balance to test an explanation.
A lake with 150 m³ input and 120 m³ output gains 30 m³ in the stated interval. Converting that volume to a level change requires the relevant surface area or a volume-level relation.
Pause and explain
What extra information is needed to turn storage-volume change into water-level change?
Check your reasoning after answering
Reservoir geometry, such as area or a valid relationship between volume and level.
Apply the whole unit · A pond after a storm
Illustrative daily volumes in m³: rain onto pond 40, inflow 100, outflow 90, evaporation 10, seepage out 20.
Your task
Draw and label the flows, calculate storage change, and explain which measurements would test an observed level rise.
What your response should show
- Use the supplied evidence accurately and label units or locations.
- Explain a physical mechanism or evidence-to-claim relationship.
- Show calculations or a clearly labeled model when the task calls for one.
- Identify a meaningful assumption, uncertainty, or competing explanation.
Response guidance — after your attempt
Inputs = 140; outputs = 120; storage increases 20 m³. Compare measured level with pond geometry and check unmeasured inflow or leakage. The balance alone cannot identify all changing pathways from one water-level observation.
Scientific references and adapted source material
Parent / teacher teaching notes
Use a closed-system diagram and ask where energy enters evaporation. Check that the learner distinguishes vapor, droplets, storage, flux and interval without treating the cycle as a fixed circle. Ask the learner to explain each visual label and causal step before calculating. Preserve a first model, attempt the changed independent case, then use feedback to revise. Diagrams state whether values are illustrative or observed. Selected OpenSciEd excerpts are middle-school source material used for supported foundations; the independent high-school explanations and supplements are not the complete OpenSciEd teacher editions or an endorsement.
An animated diagram of the water cycle showing evaporation from the ocean, condensation into clouds, precipitation falling over land, and runoff flowing back to the ocean.
The key idea
The sun's energy lifts water into the air as vapor (evaporation and transpiration), and gravity pulls it back down as precipitation and runoff — the same water endlessly recycles through air, land, and ocean.
Worked examples
Example 1
- Start at the ocean: the sun's energy heats the surface water until it evaporates into invisible water vapor that rises into the atmosphere. (Driven by the sun.)
- As the vapor rises and drifts inland on the wind, it cools and condenses into tiny liquid droplets that cluster together as clouds. (Driven by cooling air, made possible by the sun's earlier heating.)
- The droplets in the clouds keep colliding and growing as the clouds are pushed toward the mountains, until they're heavy enough to fall as precipitation — rain. (Driven by gravity.)
- The rain that doesn't soak into the ground runs downhill as runoff, collecting into streams that flow back toward the ocean. (Driven by gravity.)
Example 2 · Worked application
- Water molecules move among reservoirs and phases.
- Evaporation requires energy; condensation transfers energy to surroundings.
- A cycle describes pathways, not every molecule following one fixed route.
Matter cycling does not mean energy follows the same closed loop.
Example 3
- The water didn't vanish — matter doesn't just disappear.
- The sun's energy heated the puddle's surface, giving water molecules enough energy to escape into the air as water vapor.
- That process — liquid water turning into water vapor — is evaporation.
Example 4
- Moist air contacts the colder surface and cools.
- Some water vapor condenses into liquid on the outside.
Example 5 · Find and fix the mistake
- Test the claim against the stated conditions: Matter cycling does not mean energy follows the same closed loop.
- Visible clouds contain tiny liquid droplets and/or ice crystals; vapor is an invisible gas.
Matter cycling does not mean energy follows the same closed loop.
Example 6 · Reason from the visual evidence
- Account for all the stated pathways over the same test interval. The bars are volumes rather than rates; the example neglects evaporation during the short test.
- 25 mL, because 100−55−20 = 25. The calculation assumes all relevant transfers and stores have been included over the matched interval.
Original supplied short-test water partition. The 100 mL input is balanced by runoff, infiltration and temporary surface storage. Actual precipitation-to-runoff behavior also depends on conditions and additional terms; the diagram is not a universal landscape partition.
Avoid these mistakes
- A cloud's visible droplets are not the same as invisible water vapor.
Check your understanding
A covered cold glass collects water outside. Explain its likely source.
Discuss the answer
The droplets can come from the air, rather than leaking through the glass.
Why should groundwater appear as a store in a water-cycle model?
Discuss the answer
Water can be stored in saturated pores/fractures and exchanged later with streams or other reservoirs. Include groundwater storage and transfers within the selected water-budget boundary rather than assuming all rain immediately runs off.
Return to the phenomenon
Return to the initial case. Why does the same rain not produce the same stream or lake response? Revise your drawing or explanation using two named ideas and one stated limitation.
Compare explanations after your attempt
Rainfall partitions under landscape conditions, and a lake responds to inputs minus outputs across an interval. Phase changes transfer energy and water; visible clouds are condensed material. Level change also depends on basin geometry.
What should we investigate next?
Which comparison would test a remaining uncertainty? State what you would change, keep comparable and measure.
Investigate, explain and revise
Complete the tasks after studying the visual parts. Keep the first model and explain a revision before consulting the guidance.
Activity 1 · Explain the opening case
Use this unit’s opening record, Parts 1–4 and your notebook model. No external equipment or text is required for this supplied-data route.
Your task
Return to the initial case. Why does the same rain not produce the same stream or lake response? Revise your drawing or explanation using two named ideas and one stated limitation.
Success criteria
- Use two stated observations or conditions.
- Connect the mechanism to a labeled diagram or calculation.
- Identify what your original model missed.
- State a useful further test and a limitation.
Hint
Name the quantities and interactions before assigning a cause.
Response guidance — discuss after your attempt
Rainfall partitions under landscape conditions, and a lake responds to inputs minus outputs across an interval. Phase changes transfer energy and water; visible clouds are condensed material. Level change also depends on basin geometry.
Activity 2 · Transfer to a changed case
Use the figures, captions and vocabulary in this unit; cover the worked answer.
Your task
A lake starts at 250 m³. Daily input is 40 m³ and output 28 m³ for five days. Find final storage and explain why the height change cannot be determined from these data alone.
Success criteria
- Use the stated measurements or conditions, with correct units.
- Connect the result to the physical mechanism or evidence relationship.
- Identify the assumption, model limit or further evidence requested.
Hint
Separate measured values, calculated results and model assumptions.
Response guidance — discuss after your attempt
Net input is 12 m³/day, so storage gains 60 m³ and reaches 310 m³. Lake area/shape or a volume-level relationship is needed for height change.
Words to know
- evaporation
- The change of liquid water into water vapor, powered by energy from the sun, mostly from the surface of oceans.
- condensation
- The change of water vapor into tiny liquid droplets as rising air cools, forming clouds.
- precipitation
- Water falling back to Earth's surface as rain, snow, sleet, or hail once droplets or ice crystals grow heavy enough.
- transpiration
- The release of water vapor from tiny openings in plant leaves; combined with evaporation, it's called evapotranspiration.
Some water molecules linger for days — others for 10,000 years
Not all parts of the water cycle move at the same pace, a concept scientists call residence time. A given water molecule spends an average of only about 9 days in the atmosphere as vapor before falling back to Earth. In rivers, water might move through in just weeks. But water locked in deep groundwater aquifers, glaciers, or polar ice sheets can sit essentially unmoving for thousands to hundreds of thousands of years. That's part of why draining an ancient underground aquifer faster than rainfall can refill it isn't like draining a bathtub — some of that water took millennia to accumulate.
The water cycle is really an energy delivery system
Evaporation doesn't just move water — it moves enormous amounts of energy, because turning liquid water into vapor requires absorbing a large quantity of heat, called latent heat, that stays locked inside the vapor invisibly until it condenses back into liquid and releases that heat again. This is exactly why sweat cools your skin (evaporating sweat carries heat away from your body) and why hurricanes are so powerful: warm ocean water evaporates massive amounts of moisture, and when that water vapor condenses into storm clouds, it dumps huge amounts of stored energy back out, fueling the storm's winds.
A warmer atmosphere holds more water — and dumps it harder
Warmer air can physically hold more water vapor than cooler air — for roughly every 1°C of warming, the atmosphere's capacity to hold moisture increases by about 7%. As global average temperatures rise, this means storms forming in a warmer world have more water vapor available to condense and fall, which is part of why scientists expect (and are already measuring) more intense, heavier bursts of precipitation during storms even in regions that see the same or less total rainfall over a year. The water cycle described in this lesson and the climate patterns of this unit are directly connected.
Before satellites: the scientist who measured a whole river basin
For centuries, some thinkers doubted that rainfall alone could possibly supply all the water flowing in rivers. In the 1670s, French scientist Pierre Perrault actually measured it: he calculated the rainfall falling across the entire Seine River's drainage basin in France and compared it to the river's flow, showing that rainfall supplied roughly six times more water than the river carried away — proving, with real data for the first time, that the modern water cycle model was quantitatively correct rather than just a reasonable guess.
New York City's water cycle shortcut: gravity, not pumps
The water cycle described in this lesson isn't just an abstract diagram — it's the entire basis of how millions of people get their drinking water. New York City's water supply, collected as precipitation across protected forested watersheds in the Catskill Mountains over 100 miles away, travels to city taps almost entirely by gravity alone, with barely any mechanical pumping required, thanks to careful engineering of the elevation drop along the aqueduct system. It's one of very few major cities in the world where gravity does nearly all the work of water delivery.
In the real world
Reservoir managers track mountain snowpack — frozen precipitation waiting to melt and run off — because it predicts how much water will be available downstream months later.
Exit check
Explain how surface water can return as precipitation, naming phase changes and energy transfers.
Check your explanation after answering
Evaporation uses energy to transfer liquid water to vapor. Air can cool to saturation; condensation forms droplets and releases energy. Particles grow and fall as precipitation. Gravity and energy from sunlight help drive the cycle.
Explain your reasoning without notes. If a key idea is missing, revisit the lesson and try again.
Problem 1
- Evaporation
- Condensation
- Precipitation
- Infiltration
Answer and explanation
Evaporation
The sun's energy heats liquid water until it evaporates into invisible water vapor.
Problem 2
- Transpiration
- Respiration
- Condensation
- Sublimation
Answer and explanation
Transpiration
Transpiration is water vapor released through tiny openings in plant leaves; combined with evaporation, it's called evapotranspiration.
Problem 3
- Precipitation
- Condensation
- Runoff
- Evaporation
Answer and explanation
Condensation
Condensation happens when rising, cooling air causes water vapor to turn back into liquid droplets, forming clouds.
Problem 4
Answer and explanation
97 %
Around 97% of Earth's water is salty ocean water; only about 3% is freshwater, and most of that is locked up as ice.
Problem 5
Answer and explanation
The sun's energy drives evaporation and transpiration, lifting liquid water into the air as vapor. Gravity pulls condensed water back down as precipitation and pulls runoff downhill into rivers, lakes, and groundwater.
Problem 6
Answer and explanation
The droplets can come from the air, rather than leaking through the glass.
Moist air contacts the colder surface and cools.
Some water vapor condenses into liquid on the outside.
Response criteria
- Use the stated conditions.
- Show the evidence or calculation.
- Explain the conclusion and any stated limitation.
Problem 7
Hints
Matter cycling does not mean energy follows the same closed loop.
Answer and explanation
Root uptake followed by transpiration releases water to the atmosphere.
Problem 8
Hints
State what the supplied observations or conditions establish, and separate that from any assumption.
Answer and explanation
Its local outflows can exceed inflows; global conservation does not require constant storage in each reservoir.
Problem 9
Answer and explanation
25 mL, because 100−55−20 = 25. The calculation assumes all relevant transfers and stores have been included over the matched interval.
Account for all the stated pathways over the same test interval. The bars are volumes rather than rates; the example neglects evaporation during the short test.
25 mL, because 100−55−20 = 25. The calculation assumes all relevant transfers and stores have been included over the matched interval.
Response criteria
- Read the labeled quantities, reference frame or objects correctly.
- Explain the relation between the visual evidence and the mechanism.
- Keep the drawing’s stated assumptions and limits in the conclusion.
Problem 10
Answer and explanation
Net input is 12 m³/day, so storage gains 60 m³ and reaches 310 m³. Lake area/shape or a volume-level relationship is needed for height change.
Subtract 40−28 = 12 m³/day.
Multiply by five days to obtain 60 m³ and add to 250.
Distinguish volume from height and request geometry.
Response criteria
- Use the stated measurements or conditions, with correct units.
- Connect the result to the physical mechanism or evidence relationship.
- Identify the assumption, model limit or further evidence requested.