Evolution, Ancestry & Biodiversity — Print · Life Science: Biology, Grade 10
Explain population change and branching ancestry using independent evidence.
Printable chapter lessons and review.
Natural Selection
Learning goals
- I can explain the four factors — heritable variation, overproduction, competition, and differential survival and reproduction — that together drive natural selection.
- I can use the concept of fitness to predict how the traits of a population will shift over many generations in a given environment.
Readings for this unit
Before this unit
Distinguish individual survival from population change.
Use three flexible study sessions: core explanation and Parts 1–2; Parts 3–4 with their reasoning checks and models; then the whole-unit application, worked examples, independent practice, and exit check. Allow about 50–60 minutes per session, including diagrams, data work, and notebook explanations. Attempt each check before opening its guidance. Schedule chapter investigations, review, and exams separately; add time where prerequisites are uncertain. Trace the explained visual parts and write a first model, then attempt the illustrated and changed independent cases. In the third session explain a correction and revise the opening account using evidence.
Start with something to explain
Why can a population change without every individual changing its own inherited trait?
Illustrative evidence case. Heritable variants contribute different numbers of reproductive descendants under a supplied condition.
Notice and wonder
Record two observations using the stated quantities or relationships. Keep observations separate from possible causes. Write one question that a new measurement could help answer.
Why can a population change without every individual changing its own inherited trait?
Your first model
Connect initial variation to survival/reproduction and later proportions.
Build the language from the idea
- natural selection
- The process by which individuals whose heritable traits are better suited to their environment tend to survive and reproduce at higher rates, so those traits become more common in the population over generations.
- variation
- The differences in heritable traits among the individuals of a population, arising ultimately from mutation and, in sexually reproducing species, the reshuffling of genes.
- overproduction
- The tendency of populations to produce far more offspring than the environment can support, which guarantees competition for limited resources.
- fitness
- A measure of an individual's reproductive success — the number of surviving, fertile offspring it leaves relative to others in the population, not its strength or size.
- adaptation
- A heritable trait, shaped by natural selection over many generations, that improves an organism's fitness in a particular environment.
- selective pressure
- An environmental factor — such as predation, climate, disease, or scarce food — that causes some variants in a population to survive and reproduce more than others.
In 1859, after decades of collecting evidence and famously five weeks studying finches and tortoises in the Galápagos Islands, Charles Darwin published a mechanism that could explain how life changes over time — and the naturalist Alfred Russel Wallace arrived at nearly the same idea independently at almost the same moment. That mechanism is natural selection, and its real power is that it needs no designer and no goal. It follows automatically from a handful of facts that are true of almost every population on Earth.
Start with those facts. First, the individuals in a population are not identical — they show variation in traits like size, speed, color, and biochemistry, and much of that variation is *heritable*, meaning it can be passed to offspring through genes. Second, populations tend toward overproduction: a single oak drops thousands of acorns and a frog lays hundreds of eggs, far more than could ever survive, so individuals inevitably compete for limited food, space, mates, and safety. Put those two facts together and a third follows: survival and reproduction cannot be random. The individuals whose particular traits happen to suit the current environment leave, on average, more offspring than the rest.
Because those helpful traits are heritable, the offspring inherit them too, and the makeup of the whole population shifts a little in the next generation — then a little more in the generation after that. This is the crucial move: evolution is not something an individual does; it is a change in a population across generations. No single beetle turns darker to hide, and no giraffe stretches its neck longer and passes the stretch to its calves. Individuals are simply born with the traits they inherited, and the environment does the 'selecting' by determining who survives to reproduce.
The engine of that selecting is the selective pressure — the specific environmental challenge doing the filtering. When a drought on a Galápagos island left only large, tough seeds, finches that happened to have deeper, stronger beaks could crack them and survive, while shallow-beaked birds starved; within a single generation the average beak in the population grew measurably deeper. When bacteria meet an antibiotic, the rare cells carrying a resistance gene survive and multiply. In each case the pressure is different, but the logic is identical.
This is also where the phrase 'survival of the fittest' gets badly misread. In biology, fitness does not mean strong, fast, or aggressive — it means *reproductively successful*. An organism that lives to a ripe old age but never reproduces has a fitness of zero, while a smaller, weaker individual that leaves many surviving offspring has high fitness. Fitness is always measured relative to a *specific* environment, too: a polar bear's thick white coat is superb fitness in the Arctic and a lethal handicap in a desert. There is no such thing as being 'fit' in the abstract.
The lasting result of this slow filtering is adaptation — a trait so well matched to its environment that it looks almost designed: the camouflage of a stick insect, the water-storing tissue of a cactus, the streamlined body of a shark. It is worth remembering what natural selection can and cannot do. It can only work with the variation already present in a population; it cannot summon a helpful trait on demand, and if the right variation never appears, a population can go extinct despite the 'need.' Selection edits; it does not invent from nothing.
Natural selection requires heritable variation and differences in reproductive success in a particular environment. Individuals experience selection, while allele or trait frequencies change in populations across generations. Organisms do not choose useful mutations because they need them.
Fitness is reproductive contribution in context, not simply physical strength or lifespan. A trait beneficial in one environment can be neutral or harmful in another. Connect the trait to a mechanism and measured survival or reproduction.
Selection is one evolutionary process alongside drift, mutation and gene flow. A population change alone does not identify which process caused it. Compare evidence about inheritance, environment and reproduction before attributing every change to adaptation.
Build your understanding
Use three flexible study sessions: core explanation and Parts 1–2; Parts 3–4 with their reasoning checks and models; then the whole-unit application, worked examples, independent practice, and exit check. Allow about 50–60 minutes per session, including diagrams, data work, and notebook explanations. Attempt each check before opening its guidance. Schedule chapter investigations, review, and exams separately; add time where prerequisites are uncertain.
Part 1 · Three conditions, one outcome
Natural selection changes inherited variants’ representation when they differ in reproductive success under conditions. Variation must be present, relevant features must be heritable, and survival or reproduction must differ. The selected individuals do not intentionally manufacture the needed allele after noticing a challenge. A population proportion can change even if no individual transforms its own inherited category. Measure the initial variants, offspring contributions and conditions rather than infer all three requirements from a later color difference alone.
Read the visual model
Identify the labeled structures and units, then trace the arrows or compare values under the caption’s stated conditions. Separate the displayed evidence from a further inference. Write your reasoning before opening the guidance.
Does the later marker distribution mean each blue individual turned gold because it needed to?
Visual reasoning — after your attempt
No. Differential contribution of inherited variants can change proportions across generations without that individual transformation.
Natural selection follows from three conditions. Individuals in a population vary. Some of that variation is heritable. And some of it affects how many offspring an individual leaves in its environment. Where all three hold, the proportions of the heritable variants change from one generation to the next, because the variants that help their bearers reproduce become more common.
Nothing in that account requires intention, effort, or a goal. It is an arithmetic consequence of unequal reproduction among differing, heritable types. Removing any one condition stops the process: without variation there is nothing to select, without heritability nothing is transmitted, and without an effect on reproduction the proportions do not shift.
Pause and explain
A population varies in a trait caused entirely by diet rather than by inheritance. Can selection on that trait change the population across generations?
Check your reasoning after answering
No. The variation is not heritable, so even if it affects survival and reproduction, offspring do not inherit their parents' version of the trait and the next generation's composition is unchanged.
Part 2 · Fitness means offspring, not strength
Fitness concerns reproductive contribution in a specified environment and population context. Equal starting numbers of parents can produce different numbers of surviving reproductive descendants. Size, strength or survival until one moment alone is not the definition. A variant that contributes more offspring in one condition can contribute fewer in another; frequency-dependent interactions and tradeoffs can matter. State what offspring stage is counted, the starting group and the interval before interpreting a measured advantage or comparing datasets.
Read the visual model
Identify the labeled structures and units, then trace the arrows or compare values under the caption’s stated conditions. Separate the displayed evidence from a further inference. Write your reasoning before opening the guidance.
Could a physically smaller variant have greater measured fitness here?
Visual reasoning — after your attempt
Yes. Fitness is the stated reproductive contribution, not a ranking by physical strength or size.
Fitness in this context means reproductive success in a particular environment: the number of surviving offspring an individual contributes. It is not strength, size, speed, or longevity, although those may contribute to it in some environments. A small, short-lived organism that leaves many surviving offspring has higher fitness than a large, long-lived one that leaves few.
Fitness is also relative to conditions. A trait that raises reproductive success in one environment can lower it in another — a thick coat in a cold climate against a warm one — so there is no such thing as a generally superior type. This is why the phrase "survival of the fittest" misleads: it suggests a fixed ranking, when what matters is reproduction under present conditions.
Pause and explain
Why is the strongest individual in a population not necessarily the fittest in the evolutionary sense?
Check your reasoning after answering
Fitness is measured by surviving offspring contributed to the next generation. Strength raises fitness only if it increases reproduction in that environment; a weaker individual that leaves more surviving offspring has higher fitness.
Part 3 · Selection sorts; mutation supplies
A mutation changes sequence; recombination rearranges existing material; inheritance transmits it. Selection concerns differential contribution among variants under conditions, not the purposeful creation of a helpful change. Some mutation processes have biases, yet this does not mean a population reliably generates exactly the trait it needs. Drift and migration also change frequencies. A changed frequency supports an evolutionary observation, while identifying its cause requires suitable comparisons and evidence of reproductive differences or other mechanisms.
Read the visual model
Identify the labeled structures and units, then trace the arrows or compare values under the caption’s stated conditions. Separate the displayed evidence from a further inference. Write your reasoning before opening the guidance.
Does observing a useful new allele prove that need caused that precise mutation?
Visual reasoning — after your attempt
No. Its origin and later contribution are distinct questions; utility after selection does not establish purposeful mutation.
Selection cannot produce the variation it acts on. Mutation during DNA replication, together with the recombination and independent assortment of meiosis, generates heritable variation without regard to what would be useful. Selection then sorts among whatever is present. Keeping these two roles separate resolves most confusion about how evolution works.
Antibiotic resistance is the clearest demonstration, because the timing can be checked. Resistant cells arise by mutation before any antibiotic is applied, which has been shown by finding resistant cells in populations never exposed to the drug. Exposure then removes susceptible cells, so the resistant ones come to dominate. The drug changed which cells reproduced; it did not create resistance.
Pause and explain
What observation would distinguish "the antibiotic caused resistance" from "the antibiotic selected pre-existing resistance"?
Check your reasoning after answering
Testing a population that has never been exposed to the antibiotic. Finding resistant individuals already present shows the variation existed independently of the drug, so exposure selected rather than created it.
Part 4 · Measuring change in a population
An allele frequency is the fraction of relevant gene copies belonging to a version; a phenotype frequency counts an observed category and can differ. The supplied frequency rises in one condition, while a comparison fluctuates near its initial value. This supports a condition-related pattern but requires controls, sampling and reproduction evidence to identify selection. Drift, migration and changed detection can supply alternatives. A model’s generation axis is not an individual’s age, and a rising variant is not necessarily beneficial in every environment.
Read the visual model
Identify the labeled structures and units, then trace the arrows or compare values under the caption’s stated conditions. Separate the displayed evidence from a further inference. Write your reasoning before opening the guidance.
What additional measurement would strengthen a selection explanation?
Visual reasoning — after your attempt
Compare reproductive contributions of inherited variants under the defined conditions, with replicated populations and alternative mechanisms considered.
Because evolution is a change in a population's composition, the evidence takes the form of frequencies measured across generations. If a trait is present in 8 percent of one generation and 24 percent two generations later, the population has changed, and the size of the change can be stated precisely. An individual's own characteristics are fixed at fertilization, so no individual evolves.
Interpreting such frequencies requires care about sampling and about alternative causes. Small samples fluctuate; immigration can change frequencies without any selection; and chance alone shifts frequencies in small populations. Attributing a measured change to selection therefore means ruling out those alternatives, not just observing that the frequency moved.
Pause and explain
A trait's frequency rises from 10 to 30 percent in a small population over three generations. Name two explanations besides selection.
Check your reasoning after answering
Chance fluctuation, which has large effects in small populations, and immigration of individuals carrying the trait from elsewhere. Ruling these out requires estimates of population size and of movement between populations.
Apply the whole unit · Account for a resistance record
Illustrative monitoring data from a bacterial population treated with one antibiotic. Before treatment: 2 percent of 10,000 sampled cells resistant. After 1 day of treatment: 38 percent of 2,000 cells. After 3 days: 90 percent of 1,200 cells. A separate sample taken from the same source population two years earlier, with no antibiotic ever applied, contained 11 resistant cells in 5,000.
Your task
Calculate the resistant proportion in the historical sample, describe the change in resistant frequency across the treatment period, and explain which measurement establishes that resistance was not created by the antibiotic. Then explain why the falling total cell counts matter to the interpretation, and state what the record cannot tell you.
What your response should show
- Choose the appropriate biological model or relationship and state the conditions it assumes.
- Show the counts, rates, ratios, or intermediate reasoning the question requires.
- Use the supplied evidence to justify the conclusion and separate observation from inference.
- Identify a meaningful limitation, uncertainty, or next measurement.
Response guidance — after your attempt
Historical sample: 11 / 5,000 = 0.22 percent resistant, in a population never exposed to the antibiotic.
Treatment period: resistant frequency rises from 2 percent to 38 percent to 90 percent, a 45-fold increase in share over three days.
Identify the decisive measurement: the unexposed historical sample, which shows resistant cells present before any exposure, so the variation pre-existed the drug.
Interpret the falling totals: sampled cell numbers drop from 10,000 to 1,200, so the resistant share rose partly because susceptible cells were killed rather than because resistant cells multiplied enormously.
Check that reasoning quantitatively: 2 percent of 10,000 is about 200 resistant cells, and 90 percent of 1,200 is about 1,080 — a roughly fivefold increase in resistant cells against a fall in the susceptible population from about 9,800 to about 120.
State the limits: the record does not identify the mutation responsible, does not show whether resistance carries a cost when the antibiotic is absent, and samples may not be representative of the whole population.
The historical sample contained 0.22 percent resistant cells with no antibiotic ever applied, which is the decisive measurement: resistance existed in the population before exposure, so the drug selected rather than created it. During treatment the resistant share rose from 2 to 38 to 90 percent, a 45-fold increase. The falling total counts matter because they show how that increase came about: resistant cells rose from roughly 200 to roughly 1,080, about fivefold, while susceptible cells fell from about 9,800 to about 120. Most of the change in proportion therefore came from susceptible cells dying rather than from a dramatic expansion of resistant ones — a distinction invisible if only percentages are reported. The record cannot identify which mutation confers resistance, cannot show whether resistance costs anything in the drug's absence, and rests on samples that may not represent the whole population; measuring frequencies after treatment ends would address the second question.
Scientific references and adapted source figures
Parent / teacher teaching notes
Two phrasings are worth correcting on sight: that organisms adapt during their lives in ways they pass on, and that a threat causes the resistance that defeats it. Both dissolve once mutation and selection are kept in separate roles — mutation supplies variation blindly, selection sorts it. The percentage-against-count distinction in the application is the quantitative point, and it is the kind of reasoning that also applies to any reported change in proportions elsewhere in the course. Ask for an explanation of each label, arrow and axis before calculation. Keep first and revised models; attempt the changed case before consulting guidance. Distinguish invented instructional records from named historical sources. Source chromosome symbols are allele-category models, not DNA sequences. These independently authored high-school supplements are not the full OpenSciEd teacher editions or an endorsement.
The key idea
Natural selection follows automatically from four facts — heritable variation, overproduction and competition, and differences in survival and reproduction — so that traits improving an individual's fitness (reproductive success) in its environment become more common in the population over generations.
Worked examples
Example 1
- Beak depth varies among individuals and is heritable (passed from parents to offspring).
- The drought is a selective pressure: only birds able to crack hard seeds get enough food to survive.
- Deeper-beaked finches survive and reproduce more than shallow-beaked ones (higher fitness in this environment).
- Because beak depth is heritable, their offspring tend to have deeper beaks, so the population's average beak depth increases over generations.
Example 2 · Worked application
- Variants differ before exposure.
- Treatment reduces survival or reproduction of susceptible bacteria.
- Resistant lineages contribute more descendants under those conditions.
Resistance can also spread through gene transfer; the scenario alone does not specify every mechanism.
Example 3
- In biology, fitness means reproductive success — the number of surviving, fertile offspring — not size, strength, or lifespan.
- Individual A leaves 2 surviving offspring; Individual B leaves 9.
- Therefore B contributes far more of its genes to the next generation.
Example 4
- Birds with that form leave more offspring under these conditions.
- Inheritance can increase the form's frequency across generations.
Example 5 · Find and fix the mistake
- Test the claim against the stated conditions: Resistance can also spread through gene transfer; the scenario alone does not specify every mechanism.
- Mutation is not directed by need; selection acts on variants, with other processes also possible.
Resistance can also spread through gene transfer; the scenario alone does not specify every mechanism.
Example 6 · Reason from the visual evidence
- A mutation changes sequence; recombination rearranges existing material; inheritance transmits it. Selection concerns differential contribution among variants under conditions, not the purposeful creation of a helpful change. Some mutation processes have biases, yet this does not mean a population reliably generates exactly the trait it needs. Drift and migration also change frequencies. A changed frequency supports an evolutionary observation, while identifying its cause requires suitable comparisons and evidence of reproductive differences or other mechanisms.
- No. Its origin and later contribution are distinct questions; utility after selection does not establish purposeful mutation.
Original process-role diagram, not a mutation-rate model or exhaustive population-genetic equation.
Avoid these mistakes
- Individuals do not intentionally evolve a needed trait during their lifetime.
Check your understanding
Drought favors birds with a heritable beak form that helps open available seeds. Explain the next-generation change.
Discuss the answer
Selection can shift the population distribution; birds did not change beaks by deciding to adapt.
Why does a benefit in one environment not guarantee a benefit everywhere?
Discuss the answer
Fitness depends on reproductive contribution under conditions, with tradeoffs and interactions. A feature advantageous here can be disadvantageous elsewhere.
Return to the phenomenon
Return to the initial case. Why can a population change without every individual changing its own inherited trait? Revise your drawing or explanation using two named ideas and one stated limitation.
Compare explanations after your attempt
Selection sorts contributions across generations; mutation origins, drift and sampling remain distinct questions.
What should we investigate next?
Which comparison would test a remaining uncertainty? State what you would change, keep comparable and measure.
Investigate, explain and revise
Complete these tasks after the teaching parts. Preserve your first model and a supported revision; use guidance after a real attempt.
Activity 1 · Return to the opening case
Use the opening question, defined terms, Parts 1–4 and your notebook. The supplied-data route needs no equipment or external account.
Your task
Return to the initial case. Why can a population change without every individual changing its own inherited trait? Revise your drawing or explanation using two named ideas and one stated limitation.
Success criteria
- Use relevant stated observations.
- Explain the mechanism with a labeled model.
- Distinguish quantities and assumptions.
- Describe a revision and a useful next test.
Hint
Follow objects, materials and information separately. Check what each measured quantity means.
Response guidance — discuss after your attempt
Selection sorts contributions across generations; mutation origins, drift and sampling remain distinct questions.
Activity 2 · Transfer to a changed case
Cover the worked guidance and use the unit explanations/figures to solve a changed problem.
Your task
Equal groups of 20 parents of two heritable variants produce 40 and 70 surviving reproductive offspring under one condition. Compare per-parent output and explain why this does not prove a universal advantage.
Success criteria
- Use the stated measurements or conditions, with correct units.
- Connect the result to the biological mechanism or evidence relationship.
- Identify the assumption, model limit or further evidence requested.
Hint
Name the stated conditions, select the relevant mechanism and show intermediate reasoning.
Response guidance — discuss after your attempt
Outputs are 2 and 3.5 offspring per parent; the second is 1.75 times the first here. Other environments, starting frequencies and interactions can change the result, so the advantage is conditional.
Words to know
- natural selection
- The process by which individuals whose heritable traits are better suited to their environment tend to survive and reproduce at higher rates, so those traits become more common in the population over generations.
- variation
- The differences in heritable traits among the individuals of a population, arising ultimately from mutation and, in sexually reproducing species, the reshuffling of genes.
- overproduction
- The tendency of populations to produce far more offspring than the environment can support, which guarantees competition for limited resources.
- fitness
- A measure of an individual's reproductive success — the number of surviving, fertile offspring it leaves relative to others in the population, not its strength or size.
- adaptation
- A heritable trait, shaped by natural selection over many generations, that improves an organism's fitness in a particular environment.
- selective pressure
- An environmental factor — such as predation, climate, disease, or scarce food — that causes some variants in a population to survive and reproduce more than others.
Two men, one theory: Darwin and Wallace
Charles Darwin spent more than twenty years quietly building his case after returning from his voyage on HMS Beagle, famously nervous about how the world would react. He was jolted into action in 1858 when Alfred Russel Wallace, a younger naturalist working in the Malay Archipelago, mailed him an essay outlining almost exactly the same idea of natural selection. Rather than compete, their work was presented jointly at the Linnean Society of London in 1858, and Darwin published On the Origin of Species the next year. It remains one of science's most striking cases of two people independently uncovering the same profound idea.
Why the giraffe-stretching myth won't die
Before Darwin, Jean-Baptiste Lamarck proposed that traits acquired during life could be inherited — a giraffe stretches its neck, so its offspring are born with longer necks. This is wrong: stretching your muscles doesn't rewrite the DNA in your egg or sperm cells. Natural selection works differently — giraffes were born with varying neck lengths, and the longer-necked ones simply reproduced more. Beware a common modern mix-up: epigenetics (chemical tags that switch genes on or off) is a real and fascinating field, but it does not resurrect Lamarck, because it does not create the new heritable DNA variation that long-term evolution requires.
Evolution caught in the act: the Grants' finches
Biologists Peter and Rosemary Grant spent decades measuring every finch on the tiny Galápagos island of Daphne Major. When a severe drought in 1977 left only large, tough seeds, birds with deeper, stronger beaks survived far better — and in just a single generation, the population's average beak depth measurably increased. Their work is one of the clearest demonstrations that natural selection isn't only a story about the distant past; it can be watched, measured, and predicted in real time.
Survival isn't everything: sexual selection
Some traits shaped by selection actually make survival harder — think of a peacock's enormous, conspicuous tail, which makes fleeing predators more difficult. These persist through sexual selection, a special case where a trait spreads because it boosts mating success rather than survival. One idea, the handicap principle, suggests that only a genuinely healthy, high-quality male can afford to grow and carry such a costly ornament, so the handicap itself becomes an honest advertisement of good genes that potential mates can trust.
Natural selection in the clinic
The bacteria that cause infections reproduce in as little as twenty minutes, so natural selection can reshape them within months. Every time antibiotics are overused, the rare resistant cells survive and multiply, producing 'superbugs' like MRSA that ordinary drugs can no longer kill. This is why the entire field of evolutionary medicine exists — and why doctors insist on using antibiotics carefully, since carelessly applied selection pressure is exactly what breeds resistance.
In the real world
Antibiotic resistance is natural selection in fast-forward: whenever antibiotics are overused, the rare bacterial cells carrying resistance genes survive and multiply while the rest die, which is exactly why doctors urge people to finish prescriptions and limit unnecessary antibiotic use to slow the evolution of drug-resistant 'superbugs.'
Exit check
What must be true for a survival difference to contribute to natural selection across generations?
Check your explanation after answering
The relevant variation must be heritable and affect reproductive contribution; survival alone without inheritance or reproduction is insufficient.
Explain your reasoning without notes. If a key idea is missing, revisit the lesson and try again.
Evidence for Evolution
Learning goals
- I can describe how fossils, comparative anatomy, embryology, molecular biology, and biogeography each provide evidence for evolution.
- I can explain why agreement among several independent lines of evidence makes the case for common ancestry so strong.
Readings for this unit
Before this unit
Compare anatomy, sequences and dated records.
Use three flexible study sessions: core explanation and Parts 1–2; Parts 3–4 with their reasoning checks and models; then the whole-unit application, worked examples, independent practice, and exit check. Allow about 50–60 minutes per session, including diagrams, data work, and notebook explanations. Attempt each check before opening its guidance. Schedule chapter investigations, review, and exams separately; add time where prerequisites are uncertain. Trace the explained visual parts and write a first model, then attempt the illustrated and changed independent cases. In the third session explain a correction and revise the opening account using evidence.
Start with something to explain
Why can similar function coexist with different ancestry?
Illustrative evidence case. Selected structures and sequences constrain different relationships, while fossil records add time with gaps.
Notice and wonder
Record two observations using the stated quantities or relationships. Keep observations separate from possible causes. Write one question that a new measurement could help answer.
Why can similar function coexist with different ancestry?
Your first model
Separate observed resemblance, defined characters and a relationship hypothesis.
Build the language from the idea
- homologous structures
- Body parts that share the same underlying anatomical plan because they were inherited from a common ancestor, even when they now perform different functions — such as the forelimbs of humans, whales, and bats.
- analogous structures
- Body parts that perform a similar function and may look alike but do not share a recent common origin — such as the wings of insects and birds — resulting from convergent evolution.
- vestigial structure
- A reduced, often nonfunctional structure that is a leftover of a fully functional feature in an ancestor, such as the human appendix or the internal hip bones of a whale.
- transitional fossil
- A fossil that shows a mix of traits from an ancestral group and its descendants, documenting change between forms — such as Tiktaalik, between fish and four-legged animals.
- biogeography
- The study of where species live and how they are distributed across the globe, which reflects their evolutionary history and the movement of the continents.
- molecular evidence
- Similarities in DNA, RNA, and protein sequences among species; the more recently two species shared an ancestor, the more alike their molecules tend to be.
No one was present to watch the whole history of life unfold, so how do we know evolution happened? The answer is the same way a detective solves a case without a video of the crime: by gathering many independent lines of evidence that all point to the same conclusion. For evolution, at least five separate kinds of evidence converge, and — crucially — they were discovered by different scientists using different tools, yet they tell the same story of common ancestry.
The first line is the fossil record. Read from deep, old rock to shallow, young rock, it shows life changing over hundreds of millions of years, and it preserves transitional fossils that capture change in the act. *Tiktaalik*, a 375-million-year-old fossil with fish-like scales and gills but also a neck and sturdy, limb-like fins, sits right between fish and the first four-legged land animals — and scientists predicted the age and location of the rocks to search in *before* they found it. A whole series of fossils likewise traces whales from four-legged land mammals to today's fully aquatic swimmers.
The second line is comparative anatomy. The forelimb of a human, the flipper of a whale, and the wing of a bat look completely different and do completely different jobs, yet inside each you find the very same bones in the very same arrangement — one upper-arm bone, two forearm bones, then wrist and finger bones. These homologous structures only make sense if all three species inherited that limb plan from a shared ancestor and then modified it. Contrast that with analogous structures, like a bird's wing and an insect's wing: both fly, but they are built on completely different plans, so their similarity reflects convergent evolution to a shared task, not shared ancestry. Even better clues are vestigial structures — the tiny hip bones buried inside whales, or the human appendix and tailbone — reduced leftovers that make sense only as inheritances from ancestors that used them.
The third line comes from comparative embryology. Very early in development, the embryos of fish, chickens, and humans look startlingly alike, and all of them grow pharyngeal arches in the throat region — structures that become gill supports in fish but are remodeled into parts of the jaw, ear, and throat in humans. Shared early development points to shared genetic instructions inherited from a common ancestor.
The fourth and arguably strongest line is molecular evidence. Every living thing on Earth — bacterium, mushroom, redwood, human — stores information in DNA and reads it with nearly the same genetic code, a unity that itself argues for a single origin of life. Better still, we can *count* the differences: the more recently two species share an ancestor, the more similar their DNA and protein sequences are. Humans and chimpanzees share about 98–99% of their DNA; humans and mice far less; humans and yeast less still. Remarkably, this molecular family tree matches the tree built from anatomy and fossils, even though the methods are completely independent.
The fifth line is biogeography — the geography of life. Oceanic islands like the Galápagos are home to unique species found nowhere else, and each most closely resembles species on the *nearest mainland*, exactly as expected if a few colonists arrived and then diverged. Australia, isolated for tens of millions of years, teems with marsupial mammals (kangaroos, koalas, wombats) filling roles that placental mammals fill elsewhere. When five independent lines of evidence — fossils, anatomy, embryology, molecules, and geography — all converge on the same branching tree of life, the case for evolution by common descent becomes about as strong as any conclusion in science.
Evidence for common ancestry includes shared anatomical patterns, fossils, development and molecular sequence relationships. Independent kinds of evidence strengthen an inference when they agree. A similar function alone can also arise through convergent evolution.
Homologous structures reflect inherited underlying relationships even when functions differ. Analogous functions do not by themselves establish close ancestry. Compare the pattern of parts and developmental or molecular evidence rather than only appearance.
A phylogenetic explanation should account for both shared features and differences. The fossil record has gaps, so missing intermediate samples do not mean there was no change. Use the full evidence and report how strongly it supports a particular relationship.
Build your understanding
Use three flexible study sessions: core explanation and Parts 1–2; Parts 3–4 with their reasoning checks and models; then the whole-unit application, worked examples, independent practice, and exit check. Allow about 50–60 minutes per session, including diagrams, data work, and notebook explanations. Attempt each check before opening its guidance. Schedule chapter investigations, review, and exams separately; add time where prerequisites are uncertain.
Part 1 · Fossils give a sequence, with gaps
A fossil record consists of preserved remains or traces with geological context. Relative order and numerical age constraints can place observations in time, but preservation and sampling are selective. A transitional combination contains features useful for interpreting relationships, not a claim that every sampled fossil is a direct ancestor. Missing records do not prove nothing happened; a complete inference tests the proposed sequence against several forms of evidence and the geological conditions.
Read the visual model
Identify the labeled structures and units, then trace the arrows or compare values under the caption’s stated conditions. Separate the displayed evidence from a further inference. Write your reasoning before opening the guidance.
Why does no category-C fossil in the oldest sampled bed not prove C existed nowhere at that time?
Visual reasoning — after your attempt
Habitat, preservation, sampling and dating context limit the inference from one record.
In undisturbed sedimentary rock, lower layers were deposited earlier, so the vertical order of fossils provides a relative time sequence. That sequence shows change: groups appear, persist, and disappear, and the assemblages in older layers differ systematically from those in younger ones. Radiometric dating of associated rocks converts relative order into estimated ages.
The record is also incomplete, and saying so is part of using it well. Fossilization requires rapid burial and usually hard parts, so most organisms leave nothing; of those that do, many fossils have been destroyed or remain unexposed. An absence therefore has two possible causes — the group was not there, or it was not preserved or found — so arguments from missing fossils are weak in both directions.
Pause and explain
Why is the absence of fossils for a group during an interval weak evidence that the group did not exist then?
Check your reasoning after answering
Non-preservation and non-discovery produce the same absence as non-existence. Because fossilization is rare and requires particular conditions, most organisms from any interval leave no record, so absence cannot distinguish between those explanations.
Part 2 · Structures: shared plan against shared function
Homologous structures share an ancestral basis, even when their functions differ. Analogous features can serve similar functions through separate evolutionary histories, as in selected flight adaptations. Similarity alone is not enough: compare position, development, detailed structure and molecular evidence. The same broad organ can include homologous underlying parts and independently acquired specializations. Avoid calling every similar-looking outline closely related or every different function unrelated; the explanation depends on the character and level being compared.
Read the visual model
Identify the labeled structures and units, then trace the arrows or compare values under the caption’s stated conditions. Separate the displayed evidence from a further inference. Write your reasoning before opening the guidance.
Does different present-day function rule out homology of an underlying limb plan?
Visual reasoning — after your attempt
No. Descendants can retain an ancestral plan while modifying it for different functions.
Comparative anatomy distinguishes two kinds of similarity. Homologous structures share an underlying plan inherited from a common ancestor even when their functions differ: the forelimbs of a human, a bat, and a whale contain the same bones in the same arrangement, differing in proportion. Analogous structures serve similar functions but differ in plan and ancestry, as a bird's wing and an insect's wing do.
Only homology is evidence of relatedness, which makes the distinction the central skill here. Similarity of appearance or function is not enough, because selection repeatedly produces similar solutions in unrelated lineages — streamlined bodies in dolphins and sharks, for instance. Vestigial structures, reduced and without their ancestral function, are a further case of inherited plan persisting after function changed.
Pause and explain
Why does a dolphin's resemblance to a shark not indicate close relatedness?
Check your reasoning after answering
The resemblance is in outline and function, both shaped by the demands of fast swimming, so it can arise independently. The dolphin's inherited features — mammalian skeleton, lungs, milk — align it with mammals, and inherited plan rather than functional resemblance is what indicates ancestry.
Part 3 · Molecular comparison
An alignment places corresponding sequence positions for comparison. Differences can reflect mutation, shared history and other processes, while different regions evolve under different constraints and rates. A short sequence match alone can arise by chance or be insufficiently informative. Compare suitable homologous sequences, account for uncertainty and test multiple independent regions when possible. Shared derived patterns can support relationships, but a simple difference count does not directly give elapsed time without a calibrated model and assumptions.
Read the visual model
Identify the labeled structures and units, then trace the arrows or compare values under the caption’s stated conditions. Separate the displayed evidence from a further inference. Write your reasoning before opening the guidance.
Could one short matching sequence establish an exact divergence date?
Visual reasoning — after your attempt
No. Dating requires appropriate models, rates/calibration, more evidence and uncertainty, not just a match.
DNA and protein sequences provide a comparison that does not depend on form at all. Species that share a more recent common ancestor have accumulated fewer differences in corresponding sequences, so counting differences estimates relatedness. Because the same genes can be compared across very distantly related organisms, the method reaches relationships that anatomy cannot resolve.
The method's assumptions should be stated. It supposes that differences accumulate at a broadly comparable rate in the lineages compared, that reversals and repeated changes at the same site do not distort the count badly, and that the sequences being compared are genuinely corresponding ones. Where these hold imperfectly, estimates of timing are less reliable than estimates of branching order.
Pause and explain
Species A differs from a reference by 4 amino acids and species B by 12. What is the stronger conclusion, and what is weaker?
Check your reasoning after answering
The stronger conclusion is about order: B's lineage diverged earlier than A's. The weaker one is about timing — that B diverged three times as long ago — because it assumes a comparable rate of change and no repeated or reversed substitutions.
Part 4 · Independent lines that agree
Independent evidence constrains predictions using different observations or methods. A relationship model may explain structural patterns, sequence similarities and temporal context together. Agreement strengthens an explanation when the observations are appropriate and not copies of one source. Disagreement can reveal mistaken homology, incomplete sampling or a model needing revision. Counting supporting examples is not a universal probability or proof score; state how each observation tests a specific predicted relationship and what alternatives remain.
Read the visual model
Identify the labeled structures and units, then trace the arrows or compare values under the caption’s stated conditions. Separate the displayed evidence from a further inference. Write your reasoning before opening the guidance.
Why is three repeated drawings of the same specimen weaker than three different appropriate records?
Visual reasoning — after your attempt
Repeated drawings do not provide independent tests; distinct evidence can constrain different predictions and errors.
Further evidence comes from embryology, where related species show similar early developmental stages; from biogeography, where the distribution of species matches the history of land masses and the isolation of islands; and from directly observed selection in populations with short generations. Each line has its own weaknesses.
The strength of the case lies in their agreement. Fossil sequence, anatomical homology, embryological similarity, molecular comparison, and geographic distribution are affected by different sources of error, so a single alternative explanation would have to account for all of them simultaneously. Convergence of independent methods is the same reasoning pattern that supported endosymbiosis in the cells chapter and the double helix in the genetics chapter.
Pause and explain
Why is agreement between methods with different weaknesses more persuasive than a large amount of evidence of one kind?
Check your reasoning after answering
Evidence of one kind shares one set of possible errors, so a flaw in the method affects all of it. Methods with different weaknesses fail in different ways, so an alternative explanation would have to account for all of them at once, which is far more demanding.
Apply the whole unit · Weigh four kinds of evidence
Illustrative comparisons for four species against a reference mammal. Species P: forelimb with the same bone arrangement, 6 amino-acid differences in a shared protein, fossils of its lineage appear in younger layers. Species Q: streamlined body of similar outline, 71 amino-acid differences, cartilage skeleton, fossils of its lineage appear in much older layers. Species R: forelimb with the same bone arrangement but used for flight, 19 amino-acid differences. Species S: wings of entirely different construction, 94 amino-acid differences.
Your task
Rank the four species by likely closeness of relationship to the reference, name the single most informative piece of evidence for each, identify which similarity in the data is analogous rather than homologous, and explain why the body-outline similarity of species Q is misleading. Then state what additional evidence would most improve the ranking.
What your response should show
- Choose the appropriate biological model or relationship and state the conditions it assumes.
- Show the counts, rates, ratios, or intermediate reasoning the question requires.
- Use the supplied evidence to justify the conclusion and separate observation from inference.
- Identify a meaningful limitation, uncertainty, or next measurement.
Response guidance — after your attempt
Rank by molecular differences: P with 6, R with 19, Q with 71, S with 94 — closest to most distant.
Species P: 6 differences plus the same forelimb bone arrangement, two lines agreeing, so the closest relationship is well supported.
Species R: the same bone arrangement used for a different function is homologous, and 19 differences place it further than P but much closer than Q or S.
Species Q: the streamlined outline is analogous, arising from the demands of swimming, and the cartilage skeleton together with 71 differences places it distant.
Species S: wings of different construction are analogous too, and 94 differences make it the most distant of the four.
Explain the trap in Q: outline is shaped by environment and function and can arise independently, so it is not inherited evidence; the cartilage skeleton and the sequence differences are inherited features and they point the other way.
Improve the ranking: compare several genes rather than one protein, and use dated fossils to calibrate the branching order against time.
The ranking from closest to most distant is P, R, Q, S, following the molecular differences of 6, 19, 71, and 94. For P the evidence is strongest because two independent lines agree: few sequence differences and the same forelimb bone arrangement. R is informative in a different way, since its forelimb has the ancestral bone arrangement adapted to flight — a homologous structure with a changed function, which is evidence of ancestry rather than of current similarity. Q is the instructive case: its streamlined outline resembles the reference, but outline is analogous, produced by the demands of swimming in unrelated lineages, while its cartilage skeleton and 71 sequence differences are inherited features placing it far away. S's wings are likewise analogous. The ranking would be improved by comparing many genes rather than one protein, which reduces the effect of unusual rates at a single locus, and by using dated fossils to calibrate branching order against actual time.
Scientific references and adapted source figures
Parent / teacher teaching notes
The homologous-against-analogous distinction is the whole unit, and the fastest way to test it is to ask what the similarity is in: inherited plan, or current function. Dolphins and sharks make the point in one exchange. Be explicit that each line of evidence has weaknesses and that their agreement is the argument, because that is both the honest account and the reasoning pattern this course keeps returning to. Ask for an explanation of each label, arrow and axis before calculation. Keep first and revised models; attempt the changed case before consulting guidance. Distinguish invented instructional records from named historical sources. Source chromosome symbols are allele-category models, not DNA sequences. These independently authored high-school supplements are not the full OpenSciEd teacher editions or an endorsement.
The key idea
Common ancestry is supported by at least five independent lines of evidence — the fossil record, comparative anatomy (homologous and vestigial structures), embryology, molecular similarity in DNA and proteins, and biogeography — and their agreement, despite using completely different methods, makes the case for evolution extremely strong.
Worked examples
Example 1
- Homologous structures share the same underlying skeletal plan because of common ancestry; analogous structures share only a function.
- The dolphin flipper has the mammalian limb bones (it is homologous with the human arm), but the tuna fin lacks them and is built differently.
- So the dolphin flipper and tuna fin are similar in function only — they are analogous, a product of convergent evolution to swimming.
Example 2 · Worked application
- Similar shapes can result from similar swimming demands.
- Independent anatomical and molecular evidence is needed for relatedness.
- Shared function alone can reflect convergence.
Use multiple characters rather than one superficial similarity.
Example 3
- Principle: the more recently two species share a common ancestor, the more similar their DNA sequences tend to be.
- Higher shared percentage means a more recent common ancestor.
- Order the percentages from highest to lowest: chimp (99%), mouse (85%), chicken (70%), fruit fly (40%).
Example 4
- The corresponding skeletal arrangement is a homologous pattern.
- Inherited modification can produce different functions from a shared structure.
Example 5 · Find and fix the mistake
- Test the claim against the stated conditions: Use multiple characters rather than one superficial similarity.
- Convergence and differing rates of change can mislead appearance-based comparisons.
Use multiple characters rather than one superficial similarity.
Example 6 · Reason from the visual evidence
- An alignment places corresponding sequence positions for comparison. Differences can reflect mutation, shared history and other processes, while different regions evolve under different constraints and rates. A short sequence match alone can arise by chance or be insufficiently informative. Compare suitable homologous sequences, account for uncertainty and test multiple independent regions when possible. Shared derived patterns can support relationships, but a simple difference count does not directly give elapsed time without a calibrated model and assumptions.
- No. Dating requires appropriate models, rates/calibration, more evidence and uncertainty, not just a match.
Original short illustrative sequences, not genomic data from named taxa or a calibrated molecular clock.
Avoid these mistakes
- Similar function alone is not proof of close common ancestry.
Check your understanding
A bat wing and human arm share an underlying bone pattern but differ in function. What inference fits?
Discuss the answer
The pattern supports common ancestry, with other evidence strengthening the relationship.
How can convergent evolution produce similarities without close relationship?
Discuss the answer
Similar pressures can produce analogous functional features through different histories. Appropriate structural, developmental and molecular records help distinguish convergence from close ancestry.
Return to the phenomenon
Return to the initial case. Why can similar function coexist with different ancestry? Revise your drawing or explanation using two named ideas and one stated limitation.
Compare explanations after your attempt
Homology, analogy and convergence concern different histories; multiple independent records are stronger than resemblance alone.
What should we investigate next?
Which comparison would test a remaining uncertainty? State what you would change, keep comparable and measure.
Investigate, explain and revise
Complete these tasks after the teaching parts. Preserve your first model and a supported revision; use guidance after a real attempt.
Activity 1 · Return to the opening case
Use the opening question, defined terms, Parts 1–4 and your notebook. The supplied-data route needs no equipment or external account.
Your task
Return to the initial case. Why can similar function coexist with different ancestry? Revise your drawing or explanation using two named ideas and one stated limitation.
Success criteria
- Use relevant stated observations.
- Explain the mechanism with a labeled model.
- Distinguish quantities and assumptions.
- Describe a revision and a useful next test.
Hint
Follow objects, materials and information separately. Check what each measured quantity means.
Response guidance — discuss after your attempt
Homology, analogy and convergence concern different histories; multiple independent records are stronger than resemblance alone.
Activity 2 · Transfer to a changed case
Cover the worked guidance and use the unit explanations/figures to solve a changed problem.
Your task
Two organisms have similar flight function but different structural/developmental details, while other sequences support separate lineages. Explain how convergence differs from evidence of close ancestry.
Success criteria
- Use the stated measurements or conditions, with correct units.
- Connect the result to the biological mechanism or evidence relationship.
- Identify the assumption, model limit or further evidence requested.
Hint
Name the stated conditions, select the relevant mechanism and show intermediate reasoning.
Response guidance — discuss after your attempt
Similar selection pressures can produce analogous functional resemblance through convergence. Close ancestry requires appropriate shared derived/homologous evidence, supported by independent records; function alone does not settle it.
Words to know
- homologous structures
- Body parts that share the same underlying anatomical plan because they were inherited from a common ancestor, even when they now perform different functions — such as the forelimbs of humans, whales, and bats.
- analogous structures
- Body parts that perform a similar function and may look alike but do not share a recent common origin — such as the wings of insects and birds — resulting from convergent evolution.
- vestigial structure
- A reduced, often nonfunctional structure that is a leftover of a fully functional feature in an ancestor, such as the human appendix or the internal hip bones of a whale.
- transitional fossil
- A fossil that shows a mix of traits from an ancestral group and its descendants, documenting change between forms — such as Tiktaalik, between fish and four-legged animals.
- biogeography
- The study of where species live and how they are distributed across the globe, which reflects their evolutionary history and the movement of the continents.
- molecular evidence
- Similarities in DNA, RNA, and protein sequences among species; the more recently two species shared an ancestor, the more alike their molecules tend to be.
A prediction written in rock: finding Tiktaalik
In the early 2000s, paleontologist Neil Shubin reasoned that the transition from fish to four-legged animals should have happened in rocks about 375 million years old, so his team searched Devonian-age rock in the Canadian Arctic. In 2004 they found Tiktaalik, a creature with fish scales and gills but also a mobile neck, sturdy wrist-like bones, and lungs. The power of the discovery wasn't just the fossil — it was that evolutionary theory predicted the age and type of rock to dig in before anyone found it.
From land to sea: tracing whale ancestry
Few fossil sequences are as complete as the whales'. A chain of fossils — from the four-legged, deer-sized Pakicetus, to the crocodile-like Ambulocetus ('walking whale'), to species with ever-smaller hind limbs — documents mammals returning to the ocean over roughly ten million years. Modern whales still carry tiny, internal hip and leg bones, vestigial echoes of those walking ancestors, and their DNA confirms they are most closely related to hippos among living animals.
The same code in every cell
A gene taken from a firefly can be inserted into a tobacco plant and make it glow, and a human gene can be read correctly by bacteria — because virtually every organism on Earth uses the same genetic code, the same rules for translating DNA into proteins. If life had arisen many separate times, we would expect many different codes. Instead, the near-universal code is exactly what we'd predict if all life shares a single common ancestor, making it some of the deepest molecular evidence for evolution.
Shared typos: what broken genes reveal
Most mammals make their own vitamin C, but humans, chimpanzees, and other apes cannot — we all carry the same broken version of the GULO gene, disabled by the same genetic 'typo.' A shared functional gene could be a coincidence, but sharing the identical mistake is powerful evidence of inheritance from a common ancestor, just as two students with the exact same unusual error on a test suggest a shared source. Our genomes are full of such shared pseudogenes and viral insertions sitting at identical positions across related species.
Why kangaroos live in Australia
Australia is overrun with marsupials — kangaroos, koalas, wombats — and has almost no native placental mammals, while the rest of the world shows the reverse. Biogeography explains why: Australia broke away and drifted in isolation for tens of millions of years, so its early marsupials diversified there without competition from placental mammals. The naturalist Alfred Russel Wallace even mapped a sharp boundary, now called the Wallace Line, where Asian and Australian animal groups abruptly change — a border drawn not by today's geography but by deep evolutionary history.
In the real world
Because all life shares the same genetic code and deeply similar molecules, researchers can insert a human gene into bacteria and have those bacteria mass-produce human insulin for people with diabetes — a life-saving payoff of the shared evolutionary chemistry that molecular evidence reveals.
Exit check
Why is agreement between molecular and anatomical evidence useful for common ancestry?
Check your explanation after answering
Independent evidence constrains alternative explanations and supports a consistent branching model; any one feature can be ambiguous or convergent.
Explain your reasoning without notes. If a key idea is missing, revisit the lesson and try again.
Speciation & Mechanisms of Evolution
Learning goals
- I can describe how mutation, gene flow, genetic drift, and natural selection change the allele frequencies of a population.
- I can explain how reproductive isolation causes one population to split into two separate species.
Readings for this unit
Before this unit
Use allele frequencies and distinguish random from selective effects.
Use three flexible study sessions: core explanation and Parts 1–2; Parts 3–4 with their reasoning checks and models; then the whole-unit application, worked examples, independent practice, and exit check. Allow about 50–60 minutes per session, including diagrams, data work, and notebook explanations. Attempt each check before opening its guidance. Schedule chapter investigations, review, and exams separately; add time where prerequisites are uncertain. Trace the explained visual parts and write a first model, then attempt the illustrated and changed independent cases. In the third session explain a correction and revise the opening account using evidence.
Start with something to explain
Can a variant become more frequent without being more useful?
Illustrative evidence case. A small random founder sample differs from its source, while separated populations can later diverge.
Notice and wonder
Record two observations using the stated quantities or relationships. Keep observations separate from possible causes. Write one question that a new measurement could help answer.
Can a variant become more frequent without being more useful?
Your first model
Compare frequencies, gene flow and reproductive evidence separately.
Build the language from the idea
- gene pool
- All of the alleles (gene versions) present in every individual of a population, together.
- allele frequency
- How common a particular allele is in a population's gene pool, usually written as a fraction or percentage of all copies of that gene.
- mutation
- A random change in an organism's DNA sequence; the ultimate source of all new alleles and therefore of all new genetic variation.
- gene flow
- The movement of alleles between populations when individuals (or their gametes, like pollen) migrate and interbreed, which tends to make populations more genetically similar.
- genetic drift
- Random, chance changes in allele frequencies from one generation to the next; its effect is strongest in small populations, as in the bottleneck and founder effects.
- reproductive isolation
- Any barrier — geographic, behavioral, temporal, or biological — that prevents two populations from interbreeding, allowing them to evolve independently.
- speciation
- The evolutionary process by which one ancestral species splits into two or more distinct species that can no longer interbreed.
Natural selection explains how populations *adapt*, but to understand how brand-new species arise we need to think in terms of the whole gene pool — every allele carried by every member of a population. From this point of view, evolution has a precise definition: it is a change in the population's allele frequencies over generations. Anything that shifts those frequencies is a mechanism of evolution, and biologists recognize four major ones.
The first mechanism is mutation. A mutation is a random change in DNA, and it is the ultimate source of every new allele — without it, there would be no variation for anything else to act on. Most mutations are neutral or harmful, but occasionally one produces a useful new trait. The second is gene flow: when individuals migrate between populations and interbreed (or when pollen blows from one field to another), alleles move with them. Gene flow tends to *blend* populations together, making them more genetically alike and, importantly, working against the formation of new species.
The third mechanism is genetic drift — pure chance. In any population, some individuals leave more offspring than others simply by luck, not because of their traits, and this random sampling shifts allele frequencies from generation to generation. Drift is usually minor in huge populations but becomes powerful in small ones. Two dramatic cases stand out: in a bottleneck effect, a disaster (a flood, a fire, overhunting) slashes a population to a few survivors whose gene pool, by chance, may look nothing like the original — this is why cheetahs today have startlingly low genetic diversity. In a founder effect, a few individuals colonize a new area and carry only a random sample of the original gene pool with them. The fourth mechanism is natural selection, the one non-random process, which we met in the last lesson.
So how do these mechanisms build a new species? The key ingredient is reproductive isolation — some barrier that stops two groups from interbreeding. Once two populations can no longer exchange genes, gene flow between them stops, and mutation, drift, and selection are free to push each population's gene pool in its own direction. Divergence can produce persistent reproductive barriers, although separation does not guarantee that outcome. Under the biological species model, sufficiently isolated lineages may be classified as separate species — the process of speciation.
The most common route is allopatric speciation ('allo' = other, 'patric' = homeland), where a *geographic* barrier does the isolating. A rising mountain range, a new river, a widening canyon, or a stretch of ocean splits an ancestral population in two. For example, a new river may reduce mating between two populations, but physical separation alone does not establish that two species have formed. Speciation can also happen without any geographic split — sympatric speciation — through mechanisms like a sudden doubling of chromosomes in plants, which can create a reproductive barrier, with the outcome depending on ploidy, fertility and the organisms involved.
Reproductive barriers come in two flavors, and both keep gene pools separate. Prezygotic barriers act *before* a fertilized egg (zygote) can form — for example, two species breeding in different seasons, using different mating calls, or having incompatible reproductive structures. Postzygotic barriers act *after*: hybrid offspring may form but be weak, or sterile, like the mule (a horse–donkey hybrid that cannot reproduce). Run this splitting-and-diverging process again and again across millions of years and a single ancestral species can radiate into dozens or hundreds of descendants — the raw material of all of Earth's biodiversity, which is where we turn next.
Genetic drift changes frequencies through chance sampling, especially in small populations. A bottleneck reduces population size and can alter diversity without favoring a useful trait. Gene flow transfers alleles among populations through movement and reproduction.
Speciation involves the evolution of reproductive isolation, with mechanisms varying among organisms. Geographic separation can help populations diverge but does not guarantee new species. Continued gene flow may maintain similarity even across some barriers.
Several processes can operate together. Compare population size, migration, environment and mating evidence before choosing a mechanism. An observed frequency change is an outcome to explain, not automatic evidence for selection.
Build your understanding
Use three flexible study sessions: core explanation and Parts 1–2; Parts 3–4 with their reasoning checks and models; then the whole-unit application, worked examples, independent practice, and exit check. Allow about 50–60 minutes per session, including diagrams, data work, and notebook explanations. Attempt each check before opening its guidance. Schedule chapter investigations, review, and exams separately; add time where prerequisites are uncertain.
Part 1 · What makes two populations separate species
A species concept provides criteria for distinguishing groups; the biological concept emphasizes reproductive relationships but is not easily applied to all fossils, asexual organisms or hybridizing groups. Gene flow transfers alleles among populations through migration and reproduction. A barrier can reduce flow without immediately producing two species. Compare reproductive isolation, lineage evidence and the relevant organism rather than treating distance or visual difference as a sufficient universal rule. Classification decisions can involve uncertain boundaries and revisable evidence.
Read the visual model
Identify the labeled structures and units, then trace the arrows or compare values under the caption’s stated conditions. Separate the displayed evidence from a further inference. Write your reasoning before opening the guidance.
Does separation by a road automatically create two species?
Visual reasoning — after your attempt
No. Isolation, reproduction, gene flow and lineage evidence must be evaluated under an appropriate concept.
The biological species concept defines a species by reproductive compatibility: populations belong to one species if they interbreed under natural conditions and produce fertile offspring. Appearance is not the criterion, which is why two very similar populations may be separate species and two visibly different ones may not. Isolation can also be effective without being absolute, as when hybrids are produced but are sterile.
The concept has limits worth acknowledging. It cannot be applied to organisms that do not reproduce sexually, nor directly to fossils, and some populations interbreed partially in zones where they meet. These are not reasons to abandon it but reasons to state which concept is being used, since definitions in biology are tools rather than facts about nature.
Pause and explain
Two populations mate readily but their offspring are always sterile. Are they one species or two under the biological species concept?
Check your reasoning after answering
Two. Because the hybrids cannot reproduce, no alleles pass between the populations through them, so they are reproductively isolated in effect even though mating occurs.
Part 2 · Isolation allows divergence
Divergence is increasing difference between populations in a defined feature. With reduced gene flow, selection, drift and mutation can produce different histories. Reproductive isolation can arise through several barriers, including timing, behavior or offspring-related effects; geographic distance alone does not demonstrate them. A variant-frequency difference is one observation rather than proof of completed speciation. Test whether populations exchange genes and which mechanisms predict the observed changes, accounting for sampling and historical context.
Read the visual model
Identify the labeled structures and units, then trace the arrows or compare values under the caption’s stated conditions. Separate the displayed evidence from a further inference. Write your reasoning before opening the guidance.
Why is the difference between these frequency curves not enough to name two species?
Visual reasoning — after your attempt
The curves do not directly establish reproductive isolation or a complete lineage relationship; other evidence and a species concept are needed.
Gene flow — the movement of alleles between populations through migration and interbreeding — keeps populations similar by mixing their gene pools. When a barrier such as water, a mountain range, or a change in habitat interrupts it, each population accumulates its own mutations and experiences its own selective pressures, so differences build up independently.
Over enough generations those accumulated differences can make the populations reproductively incompatible, often as a by-product rather than as a direct effect of selection: differences in timing of breeding, in courtship behaviour, or in chromosome structure can prevent successful interbreeding without ever having been selected for that purpose. Isolation therefore allows speciation rather than causing it directly.
Pause and explain
Why is reproductive incompatibility often described as a by-product of divergence?
Check your reasoning after answering
The differences that accumulate during isolation are driven by mutation, drift, and local selection, none of which acts to prevent interbreeding with the other population. Incompatibility arises incidentally once enough differences have built up.
Part 3 · Drift, bottlenecks, and founders
Genetic drift is chance change in allele frequencies associated with finite reproductive sampling. A bottleneck sharply reduces population size; a founder effect concerns a small group establishing a new population. Random loss can alter representation and remove variants without proving a selective advantage. Drift can occur alongside selection and gene flow. The source gold fraction here is 6/24=1/4, while the selected survivor sample is 3/6=1/2. This example illustrates a possible outcome, not a required direction for all bottlenecks.
Read the visual model
Identify the labeled structures and units, then trace the arrows or compare values under the caption’s stated conditions. Separate the displayed evidence from a further inference. Write your reasoning before opening the guidance.
Does the gold fraction increase prove gold individuals were better adapted?
Visual reasoning — after your attempt
No. The stated random sampling can change frequency without a fitness difference; mechanism evidence is needed.
Not all change in allele frequency is caused by selection. Genetic drift is change due to chance in which individuals happen to reproduce, and its effects are proportionally larger in small populations. Drift can increase the frequency of a neutral allele, and can even reduce a beneficial one, because its action is unrelated to an allele's effects.
Two situations make drift dominant. A bottleneck occurs when a population is drastically reduced, so the survivors' allele frequencies — which reflect chance — become the whole population's. The founder effect occurs when a few individuals establish a new population, carrying only part of the source population's variety, often in unrepresentative proportions. Both leave populations with reduced variation, which matters because variation is what selection requires.
Pause and explain
Twelve founders carry an allele at 75 percent when the source population has it at 50 percent. Does this indicate that the allele is advantageous on the island?
Check your reasoning after answering
No. With only twelve founders, chance alone can easily produce such a difference, so the frequency reflects which individuals happened to arrive. Showing an advantage would require tracking the frequency over generations and relating it to survival or reproduction.
Part 4 · Distinguishing causes from a record
A mechanism test compares predictions of selection, drift, migration or mutation under stated conditions. Replicate populations can differ by chance even under matched conditions; consistent associations with measured reproductive differences strengthen a selection account. A single jagged line is not uniquely drift, and a smooth line is not uniquely selection. Population size, migrants, inheritance and measurement uncertainty influence records. Choose follow-up measurements that separate competing causes rather than attach a mechanism label only from a curve’s appearance.
Read the visual model
Identify the labeled structures and units, then trace the arrows or compare values under the caption’s stated conditions. Separate the displayed evidence from a further inference. Write your reasoning before opening the guidance.
What would help distinguish drift from a selection explanation in these records?
Visual reasoning — after your attempt
Replicated populations, size/sampling information and direct comparisons of heritable variants’ reproductive contribution under the conditions.
Because selection, drift, gene flow, and mutation all change allele frequencies, a measured change does not identify its cause. Separating them means using additional information: population size, because drift dominates when numbers are small; evidence of migration, because gene flow requires movement; and whether the allele's effect relates to a plausible selective pressure in that environment.
The strongest evidence combines a frequency record with a demonstrated effect on survival or reproduction. Showing that individuals carrying an allele leave more offspring in the environment where its frequency is rising connects the pattern to a mechanism. Without that, a frequency change is a description in search of an explanation.
Pause and explain
What single additional measurement most helps attribute a frequency change to selection rather than drift?
Check your reasoning after answering
A measurement of reproductive success for the two variants in that environment. If carriers of the rising allele leave consistently more surviving offspring, the change is linked to the allele's effect rather than to chance; population size also matters, since drift dominates in small populations.
Apply the whole unit · Diagnose two island populations
Illustrative records. A mainland population of 50,000 lizards carries a pale-colour allele at 50 percent. Island A was colonized by about 10 individuals 60 generations ago; it now holds 4,000 lizards with the pale allele at 82 percent, and its substrate is pale sand. Island B was colonized by about 500 individuals 60 generations ago; it now holds 6,000 lizards with the pale allele at 79 percent, and its substrate is dark rock. Mark-recapture on Island B shows pale lizards surviving at 0.6 times the rate of dark ones.
Your task
For each island, decide which mechanisms could account for the allele frequency and which the data make unlikely, explain why the same final frequency of about 80 percent needs different explanations on the two islands, and state what the survival measurement on Island B implies. Then name the measurement that would settle Island A's case.
What your response should show
- Choose the appropriate biological model or relationship and state the conditions it assumes.
- Show the counts, rates, ratios, or intermediate reasoning the question requires.
- Use the supplied evidence to justify the conclusion and separate observation from inference.
- Identify a meaningful limitation, uncertainty, or next measurement.
Response guidance — after your attempt
Island A: about 10 founders means a severe founder effect, so chance alone could have set a high starting frequency; the pale substrate also makes selection for pale colour plausible, so both mechanisms are candidates.
Island B: about 500 founders makes a large founder effect unlikely, and 6,000 individuals makes ongoing drift a weak explanation for a 29-point rise.
Use Island B's survival data: pale lizards survive at 0.6 times the rate of dark ones on dark rock, so selection acts against the pale allele there, which cannot explain its rise.
Conclude for Island B: a rise against the direction of selection points to another cause — most plausibly gene flow from a pale-allele-rich population, or a correlated advantage of the allele unrelated to colour.
Explain the contrast: the same 80 percent frequency arises from different processes, so a frequency alone cannot identify a mechanism.
Settle Island A: measure survival and reproduction of pale and dark lizards on the pale substrate, and estimate the founders' allele frequency from historical or genetic evidence, which separates the founder effect from ongoing selection.
On Island A both mechanisms remain live: ten founders can set an allele far from its source frequency by chance, and a pale substrate makes selection for pale colour plausible, so the 82 percent could be a founder effect, selection, or both. On Island B the explanations available are different. Five hundred founders and a present population of 6,000 make founder effect and drift poor candidates for a 29-point rise, and the mark-recapture result shows pale lizards surviving at 0.6 times the dark rate on dark rock — selection acting against the allele that increased. A rise against the direction of measured selection points elsewhere, most plausibly to gene flow from a population rich in the pale allele, or to the allele carrying some other advantage unrelated to colour. The two islands reaching about 80 percent by different routes is the lesson: a frequency does not identify its cause. For Island A, measuring survival and reproduction of both forms on the pale substrate, and estimating the founders' own frequency, would separate the founder effect from ongoing selection.
Scientific references and adapted source figures
Parent / teacher teaching notes
Drift is the mechanism students most often forget, and the founder-effect arithmetic is the quickest way to make it real: with ten founders, a large departure from the source frequency needs no explanation beyond chance. The Island B case is deliberately awkward — the allele rises while selection pushes against it — because it forces the conclusion that a frequency change does not name its cause. Keep the species definition explicit as a tool with limits rather than a fact, since the fossil and asexual cases come up naturally. Ask for an explanation of each label, arrow and axis before calculation. Keep first and revised models; attempt the changed case before consulting guidance. Distinguish invented instructional records from named historical sources. Source chromosome symbols are allele-category models, not DNA sequences. These independently authored high-school supplements are not the full OpenSciEd teacher editions or an endorsement.
The key idea
Mutation, gene flow, drift and selection can change population allele frequencies. Reproductive barriers and divergence can contribute to speciation, but geographical separation alone does not guarantee new species. Use mating and genetic evidence under an appropriate species model.
Worked examples
Example 1
- A few individuals colonizing a new area carry only a random sample of the original gene pool — this is the founder effect, a case of genetic drift.
- By chance, the bright-color allele was overrepresented among the 12 founders compared with the 5% mainland frequency.
- Because the whole island population descends from those founders, the allele stays much more common there than on the mainland — the change was due to chance, not selection.
Example 2 · Worked application
- The founders are a small chance sample.
- Their frequencies can differ without a selective advantage.
- Later gene flow or selection can also change the population.
Random sampling differs from trait-dependent reproductive success.
Example 3
- A geographic barrier (the river) splits one population into two, cutting off gene flow between them.
- With no gene flow, mutation, genetic drift, and natural selection push each group's gene pool in a different direction.
- Over many generations the two groups diverge until they are reproductively isolated — they cannot successfully interbreed.
- The result is two separate species formed by allopatric speciation.
Example 4
- Survival in the prompt is unrelated to the allele's benefit.
- A small survivor sample can differ by chance.
Example 5 · Find and fix the mistake
- Test the claim against the stated conditions: Random sampling differs from trait-dependent reproductive success.
- Drift and gene flow can change frequencies without increased fitness.
Random sampling differs from trait-dependent reproductive success.
Example 6 · Reason from the visual evidence
- Genetic drift is chance change in allele frequencies associated with finite reproductive sampling. A bottleneck sharply reduces population size; a founder effect concerns a small group establishing a new population. Random loss can alter representation and remove variants without proving a selective advantage. Drift can occur alongside selection and gene flow. The source gold fraction here is 6/24=1/4, while the selected survivor sample is 3/6=1/2. This example illustrates a possible outcome, not a required direction for all bottlenecks.
- No. The stated random sampling can change frequency without a fitness difference; mechanism evidence is needed.
Original chance-survivor example with selected representatives, not a real event or exact expected drift trajectory.
Avoid these mistakes
- Every allele-frequency change is not natural selection.
Check your understanding
A random storm kills most of a small population regardless of genotype. Survivor allele frequencies differ. Identify a likely mechanism.
Discuss the answer
Genetic drift through a bottleneck is consistent with the scenario.
Why is geographic separation alone insufficient proof of speciation?
Discuss the answer
A barrier may reduce gene flow without establishing reproductive isolation or a distinct lineage boundary. Apply an appropriate species concept with relevant evidence.
Return to the phenomenon
Return to the initial case. Can a variant become more frequent without being more useful? Revise your drawing or explanation using two named ideas and one stated limitation.
Compare explanations after your attempt
Drift, selection and isolation have distinct mechanisms; changed proportions or distance alone do not establish adaptation or species status.
What should we investigate next?
Which comparison would test a remaining uncertainty? State what you would change, keep comparable and measure.
Investigate, explain and revise
Complete these tasks after the teaching parts. Preserve your first model and a supported revision; use guidance after a real attempt.
Activity 1 · Return to the opening case
Use the opening question, defined terms, Parts 1–4 and your notebook. The supplied-data route needs no equipment or external account.
Your task
Return to the initial case. Can a variant become more frequent without being more useful? Revise your drawing or explanation using two named ideas and one stated limitation.
Success criteria
- Use relevant stated observations.
- Explain the mechanism with a labeled model.
- Distinguish quantities and assumptions.
- Describe a revision and a useful next test.
Hint
Follow objects, materials and information separately. Check what each measured quantity means.
Response guidance — discuss after your attempt
Drift, selection and isolation have distinct mechanisms; changed proportions or distance alone do not establish adaptation or species status.
Activity 2 · Transfer to a changed case
Cover the worked guidance and use the unit explanations/figures to solve a changed problem.
Your task
A source population has 70 blue and 30 gold representatives. A stated random founder group has 2 blue and 3 gold. Compare gold fractions and explain what the change does not establish.
Success criteria
- Use the stated measurements or conditions, with correct units.
- Connect the result to the biological mechanism or evidence relationship.
- Identify the assumption, model limit or further evidence requested.
Hint
Name the stated conditions, select the relevant mechanism and show intermediate reasoning.
Response guidance — discuss after your attempt
The source fraction is 30%, the founder fraction 60%. A random sample can yield that change; it does not alone demonstrate gold advantage, new mutation or completed speciation.
Words to know
- gene pool
- All of the alleles (gene versions) present in every individual of a population, together.
- allele frequency
- How common a particular allele is in a population's gene pool, usually written as a fraction or percentage of all copies of that gene.
- mutation
- A random change in an organism's DNA sequence; the ultimate source of all new alleles and therefore of all new genetic variation.
- gene flow
- The movement of alleles between populations when individuals (or their gametes, like pollen) migrate and interbreed, which tends to make populations more genetically similar.
- genetic drift
- Random, chance changes in allele frequencies from one generation to the next; its effect is strongest in small populations, as in the bottleneck and founder effects.
- reproductive isolation
- Any barrier — geographic, behavioral, temporal, or biological — that prevents two populations from interbreeding, allowing them to evolve independently.
- speciation
- The evolutionary process by which one ancestral species splits into two or more distinct species that can no longer interbreed.
What exactly is a 'species'?
The most common definition, the biological species concept, says a species is a group whose members can interbreed and produce fertile offspring. It's powerful but imperfect: it can't be applied to asexual organisms like many bacteria, or to fossils we can't breed. It also strains against ring species, where a chain of neighboring populations can each interbreed with the next, yet the two ends of the ring — living side by side — cannot. Nature, it turns out, doesn't always sort itself into tidy boxes.
Speciation without a wall: the apple maggot fly
Speciation usually needs geographic isolation, but not always. The North American apple maggot fly traditionally laid its eggs on hawthorn fruit — until apples were introduced about 200 years ago. Some flies shifted to apples, which ripen at a different time, so apple-flies and hawthorn-flies now breed at slightly different times and rarely interbreed, even though they live in the same orchards. Biologists are essentially watching sympatric speciation begin, with reproductive isolation building without any physical barrier.
Instant new species: polyploidy in plants
In plants, a whole new species can appear in just one or two generations through polyploidy — an error in cell division that doubles the entire set of chromosomes. A polyploid offspring often can't breed with its parents' population (their chromosome numbers don't match up) but can breed with other polyploids, instantly reproductively isolated. This isn't rare trivia: staple crops such as bread wheat, cotton, and many others are polyploids, meaning some of humanity's most important foods are products of this sudden route to new species.
The genetic echo of catastrophe
When a population crashes to a handful of survivors, the bottleneck effect can leave a permanent genetic fingerprint. Northern elephant seals were hunted down to perhaps only about twenty individuals in the 1890s; though they now number in the hundreds of thousands, they carry startlingly little genetic diversity. Cheetahs show the same pattern from an ancient bottleneck — they are so genetically similar that skin grafts between unrelated individuals aren't rejected — leaving such species dangerously exposed to new diseases.
One lake, hundreds of species
When a lineage rapidly diversifies to fill many different ecological roles, biologists call it an adaptive radiation. The cichlid fish of Africa's Great Lakes are a spectacular case: Lake Malawi and Lake Victoria each host hundreds of cichlid species — specialized for scraping algae, crushing snails, even eating other fish's scales — that evolved from just a few ancestral colonists in a geologic blink. Like Darwin's Galápagos finches, they show how a single arriving species can explode into many when empty habitats and isolation are available.
In the real world
Modern cheetahs are so genetically similar that skin grafted between unrelated individuals isn't rejected by the immune system — the lasting genetic fingerprint of an ancient population bottleneck that nearly drove the species extinct, leaving today's cheetahs with dangerously little genetic diversity to face new diseases.
Exit check
Distinguish genetic drift from natural selection.
Check your explanation after answering
Drift is chance change in variant frequencies, especially influential in small populations. Selection reflects differential reproductive contribution associated with heritable traits in an environment.
Explain your reasoning without notes. If a key idea is missing, revisit the lesson and try again.
Classification & Biodiversity
Learning goals
- I can explain how living things are organized using taxonomy, binomial nomenclature, and the three-domain tree of life.
- I can interpret a cladogram using shared derived traits, and describe why biodiversity is measured and worth protecting.
Readings for this unit
Before this unit
Distinguish a classification label from an evolutionary hypothesis.
Use three flexible study sessions: core explanation and Parts 1–2; Parts 3–4 with their reasoning checks and models; then the whole-unit application, worked examples, independent practice, and exit check. Allow about 50–60 minutes per session, including diagrams, data work, and notebook explanations. Attempt each check before opening its guidance. Schedule chapter investigations, review, and exams separately; add time where prerequisites are uncertain. Trace the explained visual parts and write a first model, then attempt the illustrated and changed independent cases. In the third session explain a correction and revise the opening account using evidence.
Start with something to explain
Can two samples have the same species count but differ meaningfully in diversity?
Illustrative evidence case. Equal richness can coexist with different abundance distributions and imperfect detection.
Notice and wonder
Record two observations using the stated quantities or relationships. Keep observations separate from possible causes. Write one question that a new measurement could help answer.
Can two samples have the same species count but differ meaningfully in diversity?
Your first model
Label sample area/effort, species categories and counts rather than only “more diverse.”
Build the language from the idea
- taxonomy
- The science of naming, describing, and classifying organisms into a nested hierarchy of groups: domain, kingdom, phylum, class, order, family, genus, and species.
- binomial nomenclature
- The two-part Latin naming system, devised by Carolus Linnaeus, that gives every species a unique name from its genus and species — for example, Homo sapiens.
- domain
- The broadest, highest level of classification; all life is divided into three domains — Bacteria, Archaea, and Eukarya.
- cladogram
- A branching diagram that groups organisms by shared, derived traits to show their evolutionary relationships and common ancestry.
- shared derived trait
- A characteristic that first evolved in a common ancestor and is shared by all of its descendants, used to define groups (clades) on a cladogram — such as a backbone or hair.
- biodiversity
- The variety of life at every level — genetic diversity within a species, the number of different species, and the range of ecosystems — in a place or across the whole planet.
Life on Earth is staggeringly diverse: scientists have named roughly 1.5 million species and estimate that millions more remain undiscovered. To study that diversity without drowning in it, biologists need a system to name and organize living things — the science of taxonomy. In the 1700s, the Swedish naturalist Carolus Linnaeus built the framework we still use, sorting organisms into a nested hierarchy of ever-broader groups: domain, kingdom, phylum, class, order, family, genus, species (many students remember the order with a sentence like 'Dear King Philip Came Over For Good Soup').
Linnaeus also gave every species a unique two-word Latin name through binomial nomenclature. The first word is the genus, the second identifies the species, and the whole name is italicized — *Homo sapiens* for humans, *Panthera leo* for lions, *Panthera tigris* for tigers. Notice that lions and tigers share the genus *Panthera*: the naming system itself encodes how closely related organisms are, and a shared genus signals a closer relationship than merely sharing a family or order.
Linnaeus originally grouped organisms by how similar they *looked*, but that can mislead — remember that analogous structures make unrelated species resemble one another. Modern classification, called phylogenetics, instead groups organisms by shared ancestry, using anatomy, development, and especially DNA. The most important shift came in the 1970s, when Carl Woese compared the genetic sequences of ribosomes and discovered that the microbes then lumped together as 'bacteria' actually fall into two profoundly different groups. That discovery reorganized all of life into three domains: Bacteria, Archaea (ancient single-celled microbes, many living in extreme environments), and Eukarya (everything with complex cells — protists, fungi, plants, and animals).
To picture these relationships, biologists draw a cladogram — a branching diagram, read much like a family tree, in which each branch point represents a common ancestor. Cladograms are built from shared derived traits: features that first appeared in an ancestor and were inherited by all its descendants. On the tree of vertebrates, for instance, a backbone is a derived trait shared by fish, reptiles, and mammals; four limbs mark the branch leading to reptiles and mammals; and hair plus mammary glands mark the branch leading only to mammals. The rule for reading a cladogram is simple: two species that share a *more recent* branch point (and thus more derived traits) are more closely related than two whose branches split deeper in the past.
All of that named, mapped diversity is what we mean by biodiversity, and biologists measure it at three levels: genetic diversity (variety within a species, which — as we saw with cheetahs and crops — buffers against disease and change), species diversity (the number and evenness of different species in a place, often summarized as *species richness*), and ecosystem diversity (the range of habitats, from coral reefs to rainforests). A tropical rainforest or coral reef packed with thousands of species has far higher biodiversity than a parking lot or a single-crop field.
Biodiversity is worth protecting for intensely practical reasons as well as ethical ones. Diverse ecosystems are more stable and productive, and they provide 'ecosystem services' — pollination, clean water, flood control, carbon storage — worth trillions of dollars. Wild species are also a living library of solutions: roughly half of all prescription medicines trace back to molecules first found in nature. Yet human activity — habitat destruction, climate change, pollution, and overharvesting — is now driving extinctions hundreds of times faster than the natural background rate, leading many scientists to warn of a sixth mass extinction. Understanding evolution is what lets us see the whole picture the essential question points to: a single process, natural selection acting on varying populations across billions of years, has generated the entire branching tree of life — and protecting that tree is a choice this generation gets to make.
Classification organizes organisms, while modern systematics also aims to represent evolutionary relationships. Names and groupings can be revised as new evidence appears. A familiar common name may combine unrelated organisms or split close relatives.
Biodiversity includes genetic variation, species diversity and ecosystem variation. Counting species is one measure, not the complete description. A site with the same species count can differ in relative abundance, genetic diversity and ecological functions.
Use a classification key by following observable choices, while recognizing its scope. A key for local trees cannot identify every organism worldwide. A correct label is useful but does not explain evolutionary history without additional evidence.
Build your understanding
Use three flexible study sessions: core explanation and Parts 1–2; Parts 3–4 with their reasoning checks and models; then the whole-unit application, worked examples, independent practice, and exit check. Allow about 50–60 minutes per session, including diagrams, data work, and notebook explanations. Attempt each check before opening its guidance. Schedule chapter investigations, review, and exams separately; add time where prerequisites are uncertain.
Part 1 · A hierarchy with a purpose
Taxonomy names and organizes biological groups. A taxon is a defined group; conventional ranks such as genus and family organize nesting but do not represent equal ages or amounts of evolutionary difference. A binomial species name includes a genus and specific epithet. Modern groupings aim to reflect ancestry while identification also uses visible and molecular characters. A naming diagram can be useful without establishing that every traditional ranked group is equally informative or that classification is an immutable final list.
Read the visual model
Identify the labeled structures and units, then trace the arrows or compare values under the caption’s stated conditions. Separate the displayed evidence from a further inference. Write your reasoning before opening the guidance.
Does belonging to the same rank automatically give two groups the same evolutionary age?
Visual reasoning — after your attempt
No. Ranks are organizational categories rather than clocks or equal divergence measures.
Classification arranges organisms in nested groups — domain, kingdom, phylum, class, order, family, genus, species — each narrower than the one before. Every species receives a two-part name, its genus followed by its species identifier, which gives it a unique label usable across languages. These conventions exist to make communication precise.
The arrangement is also meant to carry information. Modern classification aims to group organisms by shared ancestry, so that a group's members share a common ancestor not shared with members of other groups. On that aim, a classification is a hypothesis about history and can be tested and revised, which distinguishes it from a filing system organized for convenience.
Pause and explain
What makes a classification testable rather than merely conventional?
Check your reasoning after answering
Because groups are intended to reflect shared ancestry, evidence about relationships — fossils, anatomy, sequences — can show that a group's members do not share a common ancestor to the exclusion of others, which requires the group to be revised.
Part 2 · Why groupings change
A relationship hypothesis explains shared and differing characters. New sequence information, sampling or interpretation of homology can revise an earlier classification based mainly on appearance. This does not mean observation becomes meaningless or every revision is arbitrary: compare how well alternative models explain appropriate evidence. Distinguish a change in a scientific name, a change in a group boundary and a new biological observation. Reliable explanations document the evidence and uncertainty rather than portray the latest label as proof by authority alone.
Read the visual model
Identify the labeled structures and units, then trace the arrows or compare values under the caption’s stated conditions. Separate the displayed evidence from a further inference. Write your reasoning before opening the guidance.
Why can similar appearance be insufficient to preserve a classification unchanged?
Visual reasoning — after your attempt
Convergence or overlooked characters can obscure ancestry, and new independent evidence may support a different grouping.
Classifications have been revised repeatedly, and the reason is informative. Early schemes relied mainly on visible structure, which can mislead because selection produces similar forms independently in unrelated lineages. Molecular comparison supplies evidence independent of form, and it has repeatedly shown that groups defined by appearance contained species with different ancestries.
Revision on this basis is a strength rather than an embarrassment. It also means a current classification should be read as the best supported arrangement given present evidence, not a final answer. The number of kingdoms and the placement of several microbial groups have changed within living memory for exactly this reason.
Pause and explain
Why did classification based on visible structure sometimes group unrelated species together?
Check your reasoning after answering
Similar structures can arise independently in unrelated lineages when they serve similar functions, so appearance can reflect shared environment rather than shared ancestry. Evidence independent of form, such as sequence data, distinguishes the two.
Part 3 · Keys identify; classification explains
A dichotomous key offers paired choices using defined characters. Reliable use requires visible or measured features, applicable life stage and the set of organisms the key covers. A wrong early choice can send the user to a plausible-looking wrong endpoint. Identification differs from an ancestry explanation: a practical key can use conspicuous traits without turning every choice into an evolutionary branching event. Report uncertainty when a specimen lacks a required feature or falls outside the key’s scope.
Read the visual model
Identify the labeled structures and units, then trace the arrows or compare values under the caption’s stated conditions. Separate the displayed evidence from a further inference. Write your reasoning before opening the guidance.
Does arriving at the same key choice prove two organisms are closest evolutionary relatives?
Visual reasoning — after your attempt
No. A key sorts using selected identifying traits; ancestry requires appropriate relationship evidence.
A dichotomous key is a sequence of paired choices about observable features that leads to a name. It is a practical identification tool and is built around features that are easy to see — leaf shape, number of legs, presence of a structure — regardless of whether those features indicate ancestry.
That makes keys and classifications different instruments with different purposes. A key can place two unrelated species adjacent to each other because they share a convenient visible feature, and this is not an error in the key. Confusing the two leads students to treat a key's structure as a claim about relationships, which it is not.
Pause and explain
A key separates organisms first by whether they have wings. Why is that not a claim about ancestry?
Check your reasoning after answering
Wings have arisen independently in several unrelated lineages, so grouping by wings is convenient for identification but does not reflect shared ancestry. The key's purpose is to reach a name efficiently, not to represent history.
Part 4 · Measuring biodiversity
Species richness counts species detected in a defined sample; evenness describes how individuals are distributed among them. Four species with counts 10,10,10,10 and four with 37,1,1,1 have equal richness and total sample count but different evenness. Detection probability, sample area and effort affect the comparison. A diversity index combines selected features under a formula; it is not a universal measure of all ecological functions or a complete list of unseen species. Define the indicator and its limits.
Read the visual model
Identify the labeled structures and units, then trace the arrows or compare values under the caption’s stated conditions. Separate the displayed evidence from a further inference. Write your reasoning before opening the guidance.
Which sample is more even, and does equal richness mean identical communities?
Visual reasoning — after your attempt
The 10,10,10,10 sample is more even; richness alone does not establish identical structure or function.
Biodiversity has more than one component. Species richness is simply the number of species present. Evenness describes how individuals are distributed among them: ten species in similar numbers represent more diversity than ten species of which one holds most individuals. Reporting richness alone can therefore make two very different communities look identical.
Sampling matters as much as the measure. Counts from quadrats or transects estimate a community from a small part of it, so the number and placement of samples affect the result, and rare species are easily missed. A biodiversity figure should be reported with the sampling method and effort, because a larger survey of the same site usually finds more species.
Pause and explain
Two samples both yield a richness of 10. Why might the communities still differ substantially in diversity?
Check your reasoning after answering
Evenness may differ. If one community has its individuals spread across the ten species and the other has 95 percent in a single species, the second is dominated by one species and its remaining nine are rare and vulnerable, so the two differ despite equal richness.
Apply the whole unit · Compare two communities
Illustrative quadrat data, 100 individuals counted in each of two meadows using the same method and effort. Meadow 1: species A 26, B 24, C 20, D 16, E 14. Meadow 2: species A 88, F 5, G 4, H 2, I 1. Both samples come from five quadrats of equal area.
Your task
State the species richness of each meadow, calculate the percentage held by the most abundant species in each, explain which meadow is more diverse and on what grounds, and explain why richness alone would have made them look identical. Then identify the sampling limitation that most affects a comparison of this kind and how you would address it.
What your response should show
- Choose the appropriate biological model or relationship and state the conditions it assumes.
- Show the counts, rates, ratios, or intermediate reasoning the question requires.
- Use the supplied evidence to justify the conclusion and separate observation from inference.
- Identify a meaningful limitation, uncertainty, or next measurement.
Response guidance — after your attempt
Richness: Meadow 1 has 5 species; Meadow 2 has 5 species — identical on this measure.
Dominance: Meadow 1's most abundant species holds 26 of 100, or 26 percent; Meadow 2's holds 88 of 100, or 88 percent.
Evenness: Meadow 1's species range from 14 to 26 percent, a narrow spread, while Meadow 2 has one species at 88 percent and three species at 2 percent or less.
Conclude: Meadow 1 is more diverse, because equal richness combined with far greater evenness means its individuals are distributed across species rather than concentrated in one.
Explain the limitation of richness: counting species ignores abundance entirely, so a community dominated by one species scores the same as a balanced one.
Identify the sampling issue: rare species are easily missed, and Meadow 2's species at 1 and 2 individuals show that a slightly different sample could have reported a richness of 3 or 4.
Address it: increase the number of quadrats and plot species found against sampling effort, continuing until the curve flattens, so that the richness estimate is stable.
Both meadows have a species richness of 5, which is exactly why richness alone is insufficient: by that measure they are identical. Their distributions are not. Meadow 1's species hold between 14 and 26 percent of individuals, while Meadow 2 has one species at 88 percent and three species at 1 to 2 percent. Meadow 1 is therefore substantially more diverse, because diversity depends on how individuals are spread among species as well as on how many species there are, and a community dominated by one species has little margin if that species declines. The sampling limitation that matters most here is the detection of rare species: Meadow 2's species at one and two individuals could easily have been missed, which would have changed its reported richness. Increasing the number of quadrats and plotting cumulative species found against effort until the curve flattens would give a richness estimate stable enough to compare, and the counts should always be reported with the method and effort used.
Scientific references and adapted source figures
Parent / teacher teaching notes
The distinction between a key and a classification is worth making explicitly, because students reasonably assume a key's branches mean relatedness. The two-meadow comparison is the unit's best exercise: identical richness with completely different structure makes the case for evenness without any need for a diversity index. Keep the revision of classifications framed as evidence working as it should, since that is accurate and it prevents the impression that scientific groupings are arbitrary. Ask for an explanation of each label, arrow and axis before calculation. Keep first and revised models; attempt the changed case before consulting guidance. Distinguish invented instructional records from named historical sources. Source chromosome symbols are allele-category models, not DNA sequences. These independently authored high-school supplements are not the full OpenSciEd teacher editions or an endorsement.
The key idea
Taxonomy names and organizes life using binomial nomenclature and a nested hierarchy from domain to species; modern classification groups organisms by shared ancestry into cladograms and the three-domain tree of life; and biodiversity — genetic, species, and ecosystem variety — is measurable, valuable, and increasingly threatened by human activity.
Worked examples
Example 1
- On a cladogram, relatedness is shown by how recently two groups share a common ancestor (a branch point).
- Lizards and crocodiles share a more recent branch point with each other than either does with frogs.
- A more recent common ancestor means a closer evolutionary relationship.
Example 2 · Worked application
- Richness equals four in both.
- Evenness differs because relative abundances differ.
- Other dimensions, including genetic and ecosystem diversity, remain unmeasured.
State which measure is being compared.
Example 3
- In binomial nomenclature, the first word is the genus and organisms in the same genus are more closely related than organisms in different genera.
- Lion and tiger share the genus Panthera; the wolf is in the genus Canis.
- Therefore lion and tiger, sharing a genus, are more closely related to each other than either is to the wolf.
Example 4
- Species richness matches at five.
- Relative abundances differ, so evenness and ecological structure can differ.
Example 5 · Find and fix the mistake
- Test the claim against the stated conditions: State which measure is being compared.
- Richness is one dimension; relative abundance and other variation also matter.
State which measure is being compared.
Example 6 · Reason from the visual evidence
- A dichotomous key offers paired choices using defined characters. Reliable use requires visible or measured features, applicable life stage and the set of organisms the key covers. A wrong early choice can send the user to a plausible-looking wrong endpoint. Identification differs from an ancestry explanation: a practical key can use conspicuous traits without turning every choice into an evolutionary branching event. Report uncertainty when a specimen lacks a required feature or falls outside the key’s scope.
- No. A key sorts using selected identifying traits; ancestry requires appropriate relationship evidence.
Original paired-choice tool, not a field key for handling unknown organisms.
Avoid these mistakes
- Species count alone is not a complete measure of biodiversity.
Check your understanding
Two communities each contain five species, but one is dominated by a single species. Are their diversity patterns identical?
Discuss the answer
No; equal richness does not establish equal biodiversity patterns.
Why can a scientific classification change when new sequence evidence appears?
Discuss the answer
New appropriate characters and sequence comparisons can challenge an earlier ancestry hypothesis. Revising groups reflects tested evidence, not necessarily a new organism or arbitrary preference.
Return to the phenomenon
Return to the initial case. Can two samples have the same species count but differ meaningfully in diversity? Revise your drawing or explanation using two named ideas and one stated limitation.
Compare explanations after your attempt
Richness, evenness, identification and ancestry are different questions; defined sampling and evidence constrain each claim.
What should we investigate next?
Which comparison would test a remaining uncertainty? State what you would change, keep comparable and measure.
Investigate, explain and revise
Complete these tasks after the teaching parts. Preserve your first model and a supported revision; use guidance after a real attempt.
Activity 1 · Return to the opening case
Use the opening question, defined terms, Parts 1–4 and your notebook. The supplied-data route needs no equipment or external account.
Your task
Return to the initial case. Can two samples have the same species count but differ meaningfully in diversity? Revise your drawing or explanation using two named ideas and one stated limitation.
Success criteria
- Use relevant stated observations.
- Explain the mechanism with a labeled model.
- Distinguish quantities and assumptions.
- Describe a revision and a useful next test.
Hint
Follow objects, materials and information separately. Check what each measured quantity means.
Response guidance — discuss after your attempt
Richness, evenness, identification and ancestry are different questions; defined sampling and evidence constrain each claim.
Activity 2 · Transfer to a changed case
Cover the worked guidance and use the unit explanations/figures to solve a changed problem.
Your task
Two equal-effort samples each contain five species. Counts are 8,8,8,8,8 versus 36,1,1,1,1. Compare richness and evenness and name one sampling limitation.
Success criteria
- Use the stated measurements or conditions, with correct units.
- Connect the result to the biological mechanism or evidence relationship.
- Identify the assumption, model limit or further evidence requested.
Hint
Name the stated conditions, select the relevant mechanism and show intermediate reasoning.
Response guidance — discuss after your attempt
Both have richness five and total 40, but the first is more even. Detection, area, timing and effort can affect observed richness; unobserved species are not automatically absent.
Words to know
- taxonomy
- The science of naming, describing, and classifying organisms into a nested hierarchy of groups: domain, kingdom, phylum, class, order, family, genus, and species.
- binomial nomenclature
- The two-part Latin naming system, devised by Carolus Linnaeus, that gives every species a unique name from its genus and species — for example, Homo sapiens.
- domain
- The broadest, highest level of classification; all life is divided into three domains — Bacteria, Archaea, and Eukarya.
- cladogram
- A branching diagram that groups organisms by shared, derived traits to show their evolutionary relationships and common ancestry.
- shared derived trait
- A characteristic that first evolved in a common ancestor and is shared by all of its descendants, used to define groups (clades) on a cladogram — such as a backbone or hair.
- biodiversity
- The variety of life at every level — genetic diversity within a species, the number of different species, and the range of ecosystems — in a place or across the whole planet.
Linnaeus and the two-word name
Before the 1700s, a species might be labeled with a clumsy Latin phrase that changed from book to book. The Swedish naturalist Carolus Linnaeus fixed this in his Systema Naturae by giving each species a tidy two-part name — genus plus species — and nesting species inside ever-broader groups. He classified thousands of organisms himself, and although he grouped them by appearance rather than ancestry, his naming system was so practical that biologists worldwide still use it nearly three centuries later.
The scientist who added a domain
For most of the 20th century, life was split into two great groups: prokaryotes and eukaryotes. Then in 1977, Carl Woese compared the genetic sequences of ribosomes — machinery every cell must have — and discovered that some 'bacteria' were as different from ordinary bacteria as either was from us. These became the Archaea, and Woese reorganized all life into three domains: Bacteria, Archaea, and Eukarya. The idea was met with fierce resistance at first, a reminder that even major discoveries can take years to be accepted.
Reading the barcodes of life
Just as a supermarket scanner reads a barcode, biologists can identify a species from a short, standardized stretch of DNA — a technique called DNA barcoding. For animals, a roughly 650-base region of one mitochondrial gene often suffices to tell species apart. Barcoding has exposed mislabeled seafood in restaurants, identified insects from a single leg, and revealed that some 'single species' are actually several look-alike species hiding in plain sight.
When the tree becomes a web
We usually picture inheritance flowing straight down, parent to offspring — vertical inheritance. But microbes also swap genes sideways, even between distantly related species, through horizontal gene transfer. This is how antibiotic-resistance genes spread so alarmingly fast among bacteria. It also means that, especially near the base of life, the 'tree' is really more of a tangled web, complicating the neat branching picture and giving scientists a richer, messier view of how life's history actually unfolded.
The sixth extinction and biodiversity hotspots
Earth has endured five mass extinctions, and many scientists argue human activity is driving a sixth, with species vanishing hundreds of times faster than the natural background rate through habitat loss, climate change, and invasive species. To focus limited conservation resources, ecologists identify biodiversity hotspots — regions like Madagascar, the tropical Andes, and Southeast Asian rainforests that are extraordinarily rich in species found nowhere else and under severe threat. Protecting these hotspots safeguards a huge share of the planet's biodiversity within a relatively small area.
In the real world
Roughly half of all prescription medicines trace back to molecules first discovered in wild species — aspirin from willow bark, the cancer drug paclitaxel from the Pacific yew tree, powerful antibiotics from soil microbes — so every species lost to extinction may carry an undiscovered cure with it, one concrete reason biodiversity is worth protecting.
Exit check
Why does species richness alone not describe all biodiversity?
Check your explanation after answering
Biodiversity also includes genetic and ecosystem differences; abundance, evenness, identities, and ecological roles matter beyond the number of species.
Explain your reasoning without notes. If a key idea is missing, revisit the lesson and try again.
Reading Evolutionary Trees
Learning goals
- I can identify common ancestry from branching relationships.
- I can evaluate molecular and anatomical evidence without treating a tree as a ladder.
Readings for this unit
Before this unit
Identify a node and trace shared branches.
Use three flexible study sessions: core explanation and Parts 1–2; Parts 3–4 with their reasoning checks and models; then the whole-unit application, worked examples, independent practice, and exit check. Allow about 50–60 minutes per session, including diagrams, data work, and notebook explanations. Attempt each check before opening its guidance. Schedule chapter investigations, review, and exams separately; add time where prerequisites are uncertain. Trace the explained visual parts and write a first model, then attempt the illustrated and changed independent cases. In the third session explain a correction and revise the opening account using evidence.
Start with something to explain
Why can two differently arranged tree drawings show the same ancestry?
Illustrative evidence case. A/B branches rotate around their common node while the rooted relationships remain.
Notice and wonder
Record two observations using the stated quantities or relationships. Keep observations separate from possible causes. Write one question that a new measurement could help answer.
Why can two differently arranged tree drawings show the same ancestry?
Your first model
Mark common ancestors and distinguish topology from tip placement and branch length.
Build the language from the idea
- node
- A branching point representing a common ancestor in a tree model.
- sister lineages
- Two lineages joined at their most recent shared node.
- derived feature
- A feature changed from the ancestral state used for comparison.
A phylogenetic tree represents a hypothesis about branching ancestry. A node joins lineages at a common ancestor; taxa sharing a more recent node are more closely related on that tree. Tips are sampled lineages, not stages along a ladder from simple to superior. Living species are not automatically ancestors of other living tips.
Rotating branches around a node does not change relationships. Left-to-right placement and visual closeness can mislead. Branch length represents time or change only when the diagram explicitly defines a scale. An unresolved branching pattern indicates that the evidence or presentation does not distinguish a particular order.
Scientists compare shared derived features and molecular sequences to test trees. Similarity can also arise independently, and one short sequence can be misleading. Compare multiple independent features, appropriate models, and uncertainty. New evidence can refine a tree without erasing all earlier evidence for common ancestry.
A branch point represents a common ancestor in a tree model. Relatedness depends on the most recent shared ancestor, not the left-to-right spacing of tips. Rotating branches around a node leaves the represented relationships unchanged.
A living species at a tip is not automatically the ancestor of another living tip. Branch lengths may represent time or change only if the diagram's key says so. Without that scale, they are graphical arrangement rather than a numerical measure.
Trees are hypotheses inferred from characters or sequences and can change with evidence. Compare whether different datasets support the same grouping. Explain the evidence and uncertainties instead of treating every drawn tree as equally well established.
Build your understanding
Use three flexible study sessions: core explanation and Parts 1–2; Parts 3–4 with their reasoning checks and models; then the whole-unit application, worked examples, independent practice, and exit check. Allow about 50–60 minutes per session, including diagrams, data work, and notebook explanations. Attempt each check before opening its guidance. Schedule chapter investigations, review, and exams separately; add time where prerequisites are uncertain.
Part 1 · What the lines and nodes mean
A phylogeny is a relationship model. A node represents a common ancestor or lineage divergence under the model; a tip represents a sampled lineage. Sister groups share the most recent common ancestor relative to other included groups. The root specifies orientation in ancestry. Living tips are not automatically ancestors of other living tips, and “later on the page” does not mean more evolved. Identify nodes and ancestry relationships rather than rank organisms by visual height or complexity.
Read the visual model
Identify the labeled structures and units, then trace the arrows or compare values under the caption’s stated conditions. Separate the displayed evidence from a further inference. Write your reasoning before opening the guidance.
Which pair is closest under this supplied rooted topology?
Visual reasoning — after your attempt
A and B share the most recent common ancestor with each other; C joins at an earlier node.
A cladogram represents inferred relationships. The tips are the species or groups being compared, the lines are lineages through time, and each node is a most recent common ancestor of everything above it. Reading a tree means reading nodes: two groups are more closely related than a third if they share a node that the third does not.
Time runs from the root toward the tips. A node closer to the tips represents a more recent common ancestor, so the question "which is more closely related" is always answered by finding the most recent shared node, never by measuring the distance between tips across the page.
Pause and explain
Two tips are drawn far apart on the page but share a node near the tips. Are they closely related?
Check your reasoning after answering
Yes. Relatedness depends on how recently lineages share a common ancestor, which the node position shows. Horizontal distance across the page carries no meaning.
Part 2 · Shared derived characters build the tree
Topology is the branching relationship independent of how a tree is laid out. Rotating branches around a node changes displayed tip order while preserving shared ancestry. A shared derived character is a feature interpreted as arising on a particular lineage relative to the comparison; it can help constrain a group. Missing data, reversals and convergence can complicate character interpretation. Test character histories on the topology rather than treating adjacent printed labels as automatically sister groups.
Read the visual model
Identify the labeled structures and units, then trace the arrows or compare values under the caption’s stated conditions. Separate the displayed evidence from a further inference. Write your reasoning before opening the guidance.
Does exchanging the displayed A/B tip order make A closer to C?
Visual reasoning — after your attempt
No. The same node still links A and B; their displayed order has changed, not the topology.
Trees are inferred from characters shared by some groups and not others. A character present in an ancestor and retained widely says little about relationships within the group, because everything has it. What is informative is a derived character — one that arose in a particular lineage — because the groups sharing it are likely to have inherited it from the ancestor in which it arose.
Molecular data work the same way and supply far more characters, which is why sequence comparison has reshaped many trees. The reasoning is identical: shared derived features indicate shared ancestry, while features shared by everything, or shared because of independent origin, do not.
Pause and explain
Why is a character present in every species being compared useless for resolving relationships among them?
Check your reasoning after answering
Because all of them have it, it cannot separate any subset from the rest. It was present in their common ancestor and tells you only that they share that ancestor, which was already assumed.
Part 3 · What a tree does not claim
A branch metric may represent elapsed time, genetic change or another quantity when explicitly defined. Many classroom cladograms show topology only, so drawn horizontal distance cannot establish divergence dates or which lineage changed fastest. Missing lineages and unresolved nodes also limit interpretation. A long branch on an unscaled diagram is not evidence of greater complexity, age or survival value. Read the legend, rooting and sampling before attempting any quantitative relationship comparison.
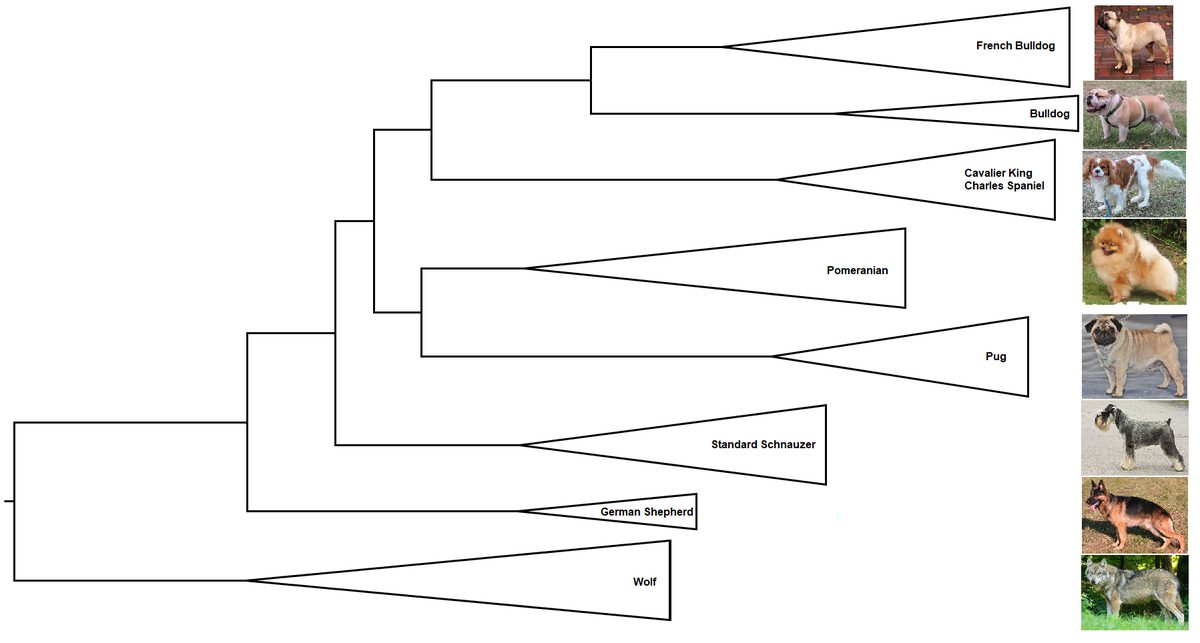
Read the visual model
Identify the labeled structures and units, then trace the arrows or compare values under the caption’s stated conditions. Separate the displayed evidence from a further inference. Write your reasoning before opening the guidance.
Can this arbitrary-length tree tell when A and B diverged?
Visual reasoning — after your attempt
No. A dated or otherwise calibrated model and uncertainty are needed; topology alone supplies relative relationships.
Several readings of a tree are not supported by it. A tip positioned to one side is not more advanced; all tips of a tree of living groups exist now and have had the same elapsed time since any common ancestor. A tip near the root's branch is not an ancestor of the others, only a lineage that separated earlier. And the tree does not claim that one living group descended from another living group.
Branch rotation makes the point concrete. Swapping the two branches at any node produces a drawing that looks different and asserts exactly the same relationships, so any conclusion that changes when branches are rotated was never supported. This is the quickest test of whether a reading is legitimate.
Pause and explain
How can branch rotation be used to check whether a conclusion is supported by a tree?
Check your reasoning after answering
Rotate the branches at a node and see whether the conclusion still holds. Rotation does not change the relationships the tree asserts, so any conclusion that depends on the original arrangement — such as a left-to-right ranking — is not supported.
Part 4 · Trees as hypotheses
A tree hypothesis is inferred from appropriate characters, sequences and models. Different datasets can disagree through limited information, gene-history differences, hybridization, errors or different assumptions. Evaluate sampling, homology, uncertainty and model fit rather than declare one disagreeing record worthless. A consensus or support measure also has a defined method and is not proof of certainty. Explain which relationship is supported and what new evidence would discriminate alternatives; do not present an unresolved node as an exactly known sequence of events.
Read the visual model
Identify the labeled structures and units, then trace the arrows or compare values under the caption’s stated conditions. Separate the displayed evidence from a further inference. Write your reasoning before opening the guidance.
What should be checked before treating dataset disagreement as proof that ancestry has no explanatory value?
Visual reasoning — after your attempt
Check character/sequence suitability, sampling, uncertainty and model assumptions; disagreement can guide a revised or more qualified hypothesis.
A tree is an inference from the characters used to build it, so it can be revised when characters are added or reinterpreted. Different datasets sometimes support different arrangements, and the honest presentation says which characters were used and how strongly they support each node rather than presenting one diagram as settled fact.
This is why sequence data changed so many trees: they added thousands of characters where anatomy offered dozens, and they are less vulnerable to independent origin of similar form. The appropriate confidence varies by node — some relationships are supported by every dataset, others remain unsettled — and a good tree reports that difference.
Pause and explain
Two datasets support different arrangements for one node. What is the appropriate way to report that node?
Check your reasoning after answering
State that the relationship at that node is unresolved, name the arrangements each dataset supports, and describe the evidence for each, rather than presenting one as established. Confidence should be reported per node, not for the tree as a whole.
Apply the whole unit · Build and critique a tree
Illustrative character matrix for four species and an outgroup, where 1 means the derived character is present. Characters: C1, C2, C3. Outgroup O: 0, 0, 0. Species Z: 1, 0, 0. Species W: 1, 1, 0. Species X: 1, 1, 1. Species Y: 1, 1, 1. All four species are living today.
Your task
Determine the branching order the matrix supports and state which character marks each node, explain why X and Y are the most closely related pair, and evaluate two claims a reader might make: that Y is the most evolved of the four, and that Z is the ancestor of the other three. Then state what additional data would best resolve the relationship between X and Y.
What your response should show
- Choose the appropriate biological model or relationship and state the conditions it assumes.
- Show the counts, rates, ratios, or intermediate reasoning the question requires.
- Use the supplied evidence to justify the conclusion and separate observation from inference.
- Identify a meaningful limitation, uncertainty, or next measurement.
Response guidance — after your attempt
Use the outgroup to identify derived states: O has none of the three characters, so 1 is the derived state in each case.
C1 is shared by Z, W, X and Y, so it marks the first node after the outgroup and groups all four together.
C2 is shared by W, X and Y but not Z, so Z branches off first and C2 marks the next node.
C3 is shared by X and Y only, so it marks the most recent node and unites that pair.
Branching order: O, then Z, then W, then X and Y as sister groups.
Evaluate the first claim: all four species are living, so none has evolved longer than another; Y's position reflects drawing order, and rotating branches at the X-Y node would put X on the right instead.
Evaluate the second claim: Z is a living species that branched earlier, not an ancestor; the ancestor at that node is extinct and is represented by the node itself, not by Z.
Resolve X and Y: the matrix gives no character separating them, so additional characters — ideally many molecular sites — are needed to determine whether they differ at all in branching position.
With the outgroup establishing 1 as the derived state, C1 unites all four species, C2 unites W, X and Y to the exclusion of Z, and C3 unites X and Y alone, giving the branching order O, then Z, then W, then X and Y as a sister pair. X and Y are the most closely related because they share the most recent node, marked by C3, and share every derived character the others have. Both reader claims fail. Y is not more evolved: all four species are living, so each lineage has had the same elapsed time since any common ancestor, and rotating the branches at the final node would place X in Y's position without changing a single relationship. Z is not an ancestor of the others either; it is a living species whose lineage separated earlier, and the ancestor at that node is extinct and represented by the node, not by any tip. The matrix provides no character distinguishing X from Y, so resolving their relationship — and testing whether they are even distinct lineages — requires many more characters, for which molecular sequence data are the practical source.
Scientific references and adapted source figures
Parent / teacher teaching notes
Branch rotation is the single most useful tool here: ask your child to redraw the tree with two branches swapped, and the "most evolved" reading collapses on its own. The living-tip point is worth stating plainly, since the idea that some living species are ancestors of others is both common and wrong. Building the tree from the character matrix by hand, using the outgroup to decide which state is derived, is what turns tree reading from pattern recognition into inference. Ask for an explanation of each label, arrow and axis before calculation. Keep first and revised models; attempt the changed case before consulting guidance. Distinguish invented instructional records from named historical sources. Source chromosome symbols are allele-category models, not DNA sequences. These independently authored high-school supplements are not the full OpenSciEd teacher editions or an endorsement.
The key idea
Read relationships from shared nodes and defined scales, then examine the evidence supporting them.
Worked examples
Example 1
- A and B meet at a node before their lineage joins C.
- Rotating A and B changes display order, not ancestry.
Example 2 · Worked application
- Trace common ancestors rather than tip spacing.
- A and B share the most recent common ancestor.
- Page arrangement can be rotated without altering those nodes.
A tree's topology carries relatedness; lengths need a declared scale.
Example 3
- Trace the shared ancestors rather than the page spacing.
- A and B share the most recent node.
Example 4 · Find and fix the mistake
- Test the claim against the stated conditions: A tree's topology carries relatedness; lengths need a declared scale.
- Tip position can change by rotating branches; shared nodes determine the represented relationship.
A tree's topology carries relatedness; lengths need a declared scale.
Example 5 · Reason from the visual evidence
- A branch metric may represent elapsed time, genetic change or another quantity when explicitly defined. Many classroom cladograms show topology only, so drawn horizontal distance cannot establish divergence dates or which lineage changed fastest. Missing lineages and unresolved nodes also limit interpretation. A long branch on an unscaled diagram is not evidence of greater complexity, age or survival value. Read the legend, rooting and sampling before attempting any quantitative relationship comparison.
- No. A dated or otherwise calibrated model and uncertainty are needed; topology alone supplies relative relationships.
Original unscaled cladogram; distances and node positions are intentionally not numerical age evidence.
Avoid these mistakes
- Tip order can change without changing the tree's relationships.
Check your understanding
In a tree, A and B share a recent node; C joins their branch at an older node. Which pair is most closely related?
Discuss the answer
A and B are the closest pair in the supplied tree.
Why does rotating a branch around its node not change relatedness?
Discuss the answer
Rotation changes the drawing’s tip order while preserving node connections and shared ancestry. Topology determines the relationship, not adjacent printed labels.
Return to the phenomenon
Return to the initial case. Why can two differently arranged tree drawings show the same ancestry? Revise your drawing or explanation using two named ideas and one stated limitation.
Compare explanations after your attempt
Shared nodes determine modeled relatedness; displayed order, progress rankings and unscaled distances do not.
What should we investigate next?
Which comparison would test a remaining uncertainty? State what you would change, keep comparable and measure.
Investigate, explain and revise
Complete these tasks after the teaching parts. Preserve your first model and a supported revision; use guidance after a real attempt.
Activity 1 · Return to the opening case
Use the opening question, defined terms, Parts 1–4 and your notebook. The supplied-data route needs no equipment or external account.
Your task
Return to the initial case. Why can two differently arranged tree drawings show the same ancestry? Revise your drawing or explanation using two named ideas and one stated limitation.
Success criteria
- Use relevant stated observations.
- Explain the mechanism with a labeled model.
- Distinguish quantities and assumptions.
- Describe a revision and a useful next test.
Hint
Follow objects, materials and information separately. Check what each measured quantity means.
Response guidance — discuss after your attempt
Shared nodes determine modeled relatedness; displayed order, progress rankings and unscaled distances do not.
Activity 2 · Transfer to a changed case
Cover the worked guidance and use the unit explanations/figures to solve a changed problem.
Your task
A rooted tree has topology ((A,B),C). A drawing is rotated to show B first, then A, then C. State the relationship and explain what is needed to estimate divergence time.
Success criteria
- Use the stated measurements or conditions, with correct units.
- Connect the result to the biological mechanism or evidence relationship.
- Identify the assumption, model limit or further evidence requested.
Hint
Name the stated conditions, select the relevant mechanism and show intermediate reasoning.
Response guidance — discuss after your attempt
A and B remain sister lineages in that topology. Tip order does not alter their shared ancestor; time estimation needs a specified calibrated branch metric/model and uncertainty.
Words to know
- node
- A branching point representing a common ancestor in a tree model.
- sister lineages
- Two lineages joined at their most recent shared node.
- derived feature
- A feature changed from the ancestral state used for comparison.
In the real world
Exit check
Name evidence that could strengthen a proposed tree.
Check your explanation after answering
Agreement among several independent anatomical features and appropriate molecular datasets, with uncertainty and alternative models considered.
Explain your reasoning without notes. If a key idea is missing, revisit the lesson and try again.
Problem 1
Answer and explanation
Heritable variation, overproduction, competition for limited resources, and differential survival and reproduction.
(1) Heritable variation: individuals in a population differ in traits that can be passed to offspring. (2) Overproduction: populations produce more offspring than the environment can support. (3) Competition: because resources are limited, individuals compete to survive. (4) Differential survival and reproduction: individuals whose traits best suit the environment survive and reproduce more, so those heritable traits become more common over generations.
Problem 2
Answer and explanation
The dark-rock population will shift toward mostly dark-colored mice, because dark mice are camouflaged there and survive and reproduce more.
On the dark rock, light-colored mice stand out and are easily caught by owls, while dark-colored mice are camouflaged and survive better. Fur color is heritable, so the surviving dark mice pass the dark-color allele to more offspring. Generation after generation, the proportion of dark mice increases until the population on the dark rock is mostly dark — natural selection favoring the better-camouflaged variant. (This is a real, well-documented example.)
Problem 3
Answer and explanation
Because peahens prefer males with large, showy tails, those males reproduce more; the reproductive advantage outweighs the survival cost, so the trait spreads.
Natural selection favors whatever leads to the most surviving offspring overall, not merely the longest survival. This is a case of sexual selection: peahens tend to choose mates with larger, more impressive tails, perhaps because such tails signal a healthy, high-quality male. Males with showier tails therefore leave more offspring. As long as that reproductive advantage outweighs the increased risk of predation, the trait raises overall fitness and becomes more common — even exaggerated — over generations.
Problem 4
Answer and explanation
Example: the same bone plan in a human arm, bat wing, and whale flipper; this reveals they descend from a common ancestor.
Homologous structures share the same underlying anatomical plan in different species even when their functions differ. The human arm, bat wing, and whale flipper all contain one upper-arm bone, two forearm bones, and hand/finger bones in the same arrangement. This shared plan only makes sense if all three inherited the limb from a common ancestor and then modified it for grasping, flying, and swimming.
Problem 5
Answer and explanation
They are vestigial structures, suggesting whales evolved from four-legged land ancestors.
These reduced, nonfunctional leg and hip bones are vestigial structures — remnants of features that were fully functional in an ancestor. Since a structure with no current use rarely appears for the first time, their presence strongly suggests that whales descended from four-legged land mammals that walked on legs, and that over evolutionary time those legs were reduced as whales adapted to a fully aquatic life. Transitional whale fossils showing progressively smaller legs support this conclusion.
Problem 6
Answer and explanation
Most to least related: chimpanzee, cow, rattlesnake, tuna. Fewer amino-acid differences indicate a more recent common ancestor, matching the anatomical tree.
The fewer differences two species have in the same protein, the more recently they shared a common ancestor. Ordering by differences gives chimpanzee (0), cow (10), rattlesnake (22), tuna (31), so that is the order from most to least closely related to humans. This matches the tree built from anatomy: chimps are fellow mammals and primates (closest), cows are mammals but not primates, the rattlesnake is a more distant reptile, and the tuna is a still more distantly related fish. Because the molecular data and the anatomical data were gathered by completely independent methods yet produce the same tree, they strongly reinforce each other as evidence for common ancestry.
Problem 7
Answer and explanation
Speciation is one species splitting into two or more species that can no longer interbreed; reproductive isolation stops gene flow so the groups can diverge.
Speciation is the process by which one ancestral species becomes two or more distinct species that can no longer successfully interbreed. Reproductive isolation is essential because it halts gene flow between two groups. Once genes stop being exchanged, mutation, genetic drift, and natural selection can push each gene pool in its own direction until the groups become too different to interbreed.
Problem 8
Answer and explanation
Reduced gene flow can allow differences to accumulate; reproductive isolation requires evidence.
Mutation, drift, and selection can change separated populations. Separation or different appearances alone do not establish separate species under a reproductive-isolation model.
Problem 9
Answer and explanation
20 copies
The founders carry 25 x 2 = 50 total copies of the gene. If the striped allele makes up 40% of the gene pool, then 0.40 x 50 = 20 copies of the striped allele are present. (Because the founding group is small and carries only a random sample of the mainland gene pool, its allele frequencies can differ sharply from the source population — the founder effect.)
Problem 10
Answer and explanation
Homo sapiens; 'Homo' is the genus and 'sapiens' is the species.
In binomial nomenclature the scientific name has two parts. The first, capitalized word is the genus (Homo), a group of closely related species; the second word identifies the specific species (sapiens). The whole name is italicized: Homo sapiens. This two-word Latin system, devised by Linnaeus, gives every species a single unique name recognized worldwide.
Problem 11
Answer and explanation
The lizard is most closely related to the cat, because they share the most recent branch point (marked by the amniotic egg).
On a cladogram, the more recently two organisms share a common ancestor — and the more shared derived traits they have — the more closely related they are. The lizard and cat share the most recent derived trait on this tree, the amniotic egg, meaning they branch from a more recent common ancestor than the cat shares with the salamander or the shark. Therefore the lizard is the cat's closest relative among these four.
Problem 12
Answer and explanation
Natural selection adapts populations, reproductive isolation repeatedly splits them into new species (speciation), and over billions of years this branching produces the diversity that classification organizes into the tree of life.
Start with one process: natural selection acting on heritable variation, which adapts populations to their environments. When populations become reproductively isolated — by geography or other barriers — gene flow stops and mutation, drift, and selection push their gene pools apart until they become separate species (speciation). Repeat this splitting again and again across billions of years, and a single ancestral lineage radiates into millions of descendant species, each a twig on an ever-branching tree. Classification (taxonomy, cladograms, the three domains) is simply our attempt to map that tree, grouping organisms by the shared derived traits their common ancestors passed down. So the same basic mechanism, run over immense time, both generates biodiversity and gives it the nested, tree-like pattern that classification reveals — which is exactly what the unit's essential question asks.
Problem 13
Answer and explanation
16 percentage points
24/300 = 8 percent and 96/400 = 24 percent, a rise of 16 percentage points.
Problem 14
Answer and explanation
An individual's genotype is fixed at fertilization, so it cannot change its heritable characteristics during its life, and changes acquired during life are not passed to offspring. What evolves is the population: the proportions of alleles and of the traits they contribute to change across generations as some individuals leave more offspring than others. Evolution is therefore a property of populations over time, not a change within an individual.
Response criteria
- State a biologically accurate conclusion.
- Show the data, mechanism, or calculation that supports it.
- Include units, conditions, or limits where relevant.
Problem 15
Answer and explanation
Outputs are 2 and 3.5 offspring per parent; the second is 1.75 times the first here. Other environments, starting frequencies and interactions can change the result, so the advantage is conditional.
Outputs are 2 and 3.5 offspring per parent; the second is 1.75 times the first here. Other environments, starting frequencies and interactions can change the result, so the advantage is conditional.
Response criteria
- Use the stated measurements or conditions, with correct units.
- Connect the result to the biological mechanism or evidence relationship.
- Identify the assumption, model limit or further evidence requested.
Problem 16
Answer and explanation
3
12 / 4 = 3 times as many differences suggests roughly three times as long since divergence, assuming a similar rate and no reversals.
Problem 17
Answer and explanation
All three contain the same set of bones in the same relative arrangement, differing in proportion rather than in plan, which indicates inheritance of a common underlying structure from a shared ancestor. The functions differ entirely — grasping, flight, swimming — so the comparison shows shared ancestry rather than shared function. What it does not show is when the lineages diverged or in what order; establishing that requires fossil evidence and molecular comparison.
Response criteria
- State a biologically accurate conclusion.
- Show the data, mechanism, or calculation that supports it.
- Include units, conditions, or limits where relevant.
Problem 18
Answer and explanation
Similar selection pressures can produce analogous functional resemblance through convergence. Close ancestry requires appropriate shared derived/homologous evidence, supported by independent records; function alone does not settle it.
Similar selection pressures can produce analogous functional resemblance through convergence. Close ancestry requires appropriate shared derived/homologous evidence, supported by independent records; function alone does not settle it.
Response criteria
- Use the stated measurements or conditions, with correct units.
- Connect the result to the biological mechanism or evidence relationship.
- Identify the assumption, model limit or further evidence requested.
Problem 19
Answer and explanation
2 %
40 / 2,000 × 100 = 2 percent. Such a bottleneck leaves a gene pool whose composition reflects which few individuals survived rather than the original population's variety.
Problem 20
Answer and explanation
Speciation has occurred under the biological species concept. The populations can mate and produce offspring, but those offspring cannot reproduce, so no alleles pass between the populations through them; reproductive isolation is therefore complete in effect even though mating still happens. The sterility of hybrids is itself the reproductive barrier, and it indicates that genetic differences accumulated far enough during isolation to disrupt the hybrids' meiosis.
Response criteria
- State a biologically accurate conclusion.
- Show the data, mechanism, or calculation that supports it.
- Include units, conditions, or limits where relevant.
Problem 21
Answer and explanation
The source fraction is 30%, the founder fraction 60%. A random sample can yield that change; it does not alone demonstrate gold advantage, new mutation or completed speciation.
The source fraction is 30%, the founder fraction 60%. A random sample can yield that change; it does not alone demonstrate gold advantage, new mutation or completed speciation.
Response criteria
- Use the stated measurements or conditions, with correct units.
- Connect the result to the biological mechanism or evidence relationship.
- Identify the assumption, model limit or further evidence requested.
Problem 22
Answer and explanation
5 %
5 / 100 × 100 = 5 percent. Reporting the distribution as well as the richness of 4 shows how unevenly individuals are spread.
Problem 23
Answer and explanation
A dichotomous key presents a series of paired choices about observable characteristics, and following the choices leads to a name. It is a tool for identifying an unknown specimen using features that are easy to see. Classification, by contrast, groups organisms to reflect evolutionary relationships, which may depend on evidence that is not visible, such as sequence data. A key may therefore use convenient features that do not indicate ancestry, so identifying an organism with a key says nothing about where it belongs in the hierarchy.
Response criteria
- State a biologically accurate conclusion.
- Show the data, mechanism, or calculation that supports it.
- Include units, conditions, or limits where relevant.
Problem 24
Answer and explanation
Both have richness five and total 40, but the first is more even. Detection, area, timing and effort can affect observed richness; unobserved species are not automatically absent.
Both have richness five and total 40, but the first is more even. Detection, area, timing and effort can affect observed richness; unobserved species are not automatically absent.
Response criteria
- Use the stated measurements or conditions, with correct units.
- Connect the result to the biological mechanism or evidence relationship.
- Identify the assumption, model limit or further evidence requested.
Problem 25
Answer and explanation
Both are present-day lineages with their own histories; a tree models branching ancestry, not ranked progress.
Problem 26
Answer and explanation
All tips of a cladogram are living or existing at the same time, so none has been evolving longer than another; each lineage has the same elapsed time since any shared ancestor. Left-to-right order is a drawing convention, and branches can be rotated at any node without changing the relationships shown. A tree represents branching order, not progress or rank, so there is no position on it that means more evolved.
Response criteria
- State a biologically accurate conclusion.
- Show the data, mechanism, or calculation that supports it.
- Include units, conditions, or limits where relevant.
Problem 27
Answer and explanation
1
Relatedness is judged by how recently lineages share a common ancestor. Node 4 is further from the root than node 2, so P and Q share a more recent ancestor and are more closely related.
Problem 28
Answer and explanation
A and B remain sister lineages in that topology. Tip order does not alter their shared ancestor; time estimation needs a specified calibrated branch metric/model and uncertainty.
A and B remain sister lineages in that topology. Tip order does not alter their shared ancestor; time estimation needs a specified calibrated branch metric/model and uncertainty.
Response criteria
- Use the stated measurements or conditions, with correct units.
- Connect the result to the biological mechanism or evidence relationship.
- Identify the assumption, model limit or further evidence requested.