Sound Waves — Practice · Grade 8 Science
Chapter: Waves, Sound & LightWhat this practice covers
By the end of Sound Waves you should be able to:
- I can describe sound as a longitudinal (compression) wave that needs a medium to travel.
- I can relate pitch to frequency and loudness to amplitude.
14 questions, numeric, multiple choice and written answer, each with a worked explanation.
Vocabulary used: longitudinal wave, compression, rarefaction, pitch, medium, model, evidence, system boundary, assumption.
Problem 1
Answer and explanation
1360 m
distance = speed × time = 340 × 4 = 1,360 m.
Problem 2
- transverse
- longitudinal
- electromagnetic
- standing only
Answer and explanation
longitudinal
Sound particles vibrate in the same direction the wave travels, making it a longitudinal wave.
Problem 3
- higher
- lower
- louder only
- quieter only
Answer and explanation
higher
Higher frequency corresponds to higher pitch.
Problem 4
- water
- steel
- a vacuum (empty space)
- air
Answer and explanation
a vacuum (empty space)
Sound needs a medium of particles to travel through, so it cannot travel through a vacuum.
Problem 5
Answer and explanation
The speaker cone vibrates back and forth, pushing air molecules together to create compressions and pulling them apart to create rarefactions. This repeating pattern travels outward through the air as a sound wave.
Problem 6
Answer and explanation
400 Hz
f = v ÷ λ = 340 ÷ 0.85 = 400 Hz.
Problem 7
Answer and explanation
68 m to the wall in this model.
Total path=340×0.4=136 m.
The path goes to the wall and back, so wall distance=136/2=68 m.
Response criteria
- Use the stated conditions.
- Show the evidence or calculation.
- Explain the conclusion and any stated limitation.
Problem 8
Hints
Remember the return path; the echo delay is not one-way time.
Answer and explanation
The 400 Hz sound, because its frequency is higher.
Problem 9
Hints
State what the supplied observations or conditions establish, and separate that from any assumption.
Answer and explanation
Sound needs particles of a medium to transmit mechanical disturbances; a vacuum lacks that medium.
Problem 10
Answer and explanation
The pressure disturbance and energy travel through the air. Individual particles move locally rather than carrying themselves from speaker to listener.
Draw a line of particles with alternating close and less-close spacing. Show travel and local motion along the same axis in the longitudinal model. Do not show one particle traveling all the way from a speaker to a listener.
The pressure disturbance and energy travel through the air. Individual particles move locally rather than carrying themselves from speaker to listener.
Response criteria
- Use the named labels, directions or supplied quantities accurately.
- Connect the visual evidence to the scientific mechanism or calculation.
- State the relevant model conditions or limitation.
Problem 11
Answer and explanation
Round-trip length is 340×0.3 = 102 m, so reflector distance is 51 m. The measured time includes travel out and back.
Draw both travel legs.
Divide total path by two only under the stated same-path out-and-back comparison.
Round-trip length is 340×0.3 = 102 m, so reflector distance is 51 m. The measured time includes travel out and back.
Response criteria
- Use the named labels, directions or supplied quantities accurately.
- Connect the visual evidence to the scientific mechanism or calculation.
- State the relevant model conditions or limitation.
Problem 12
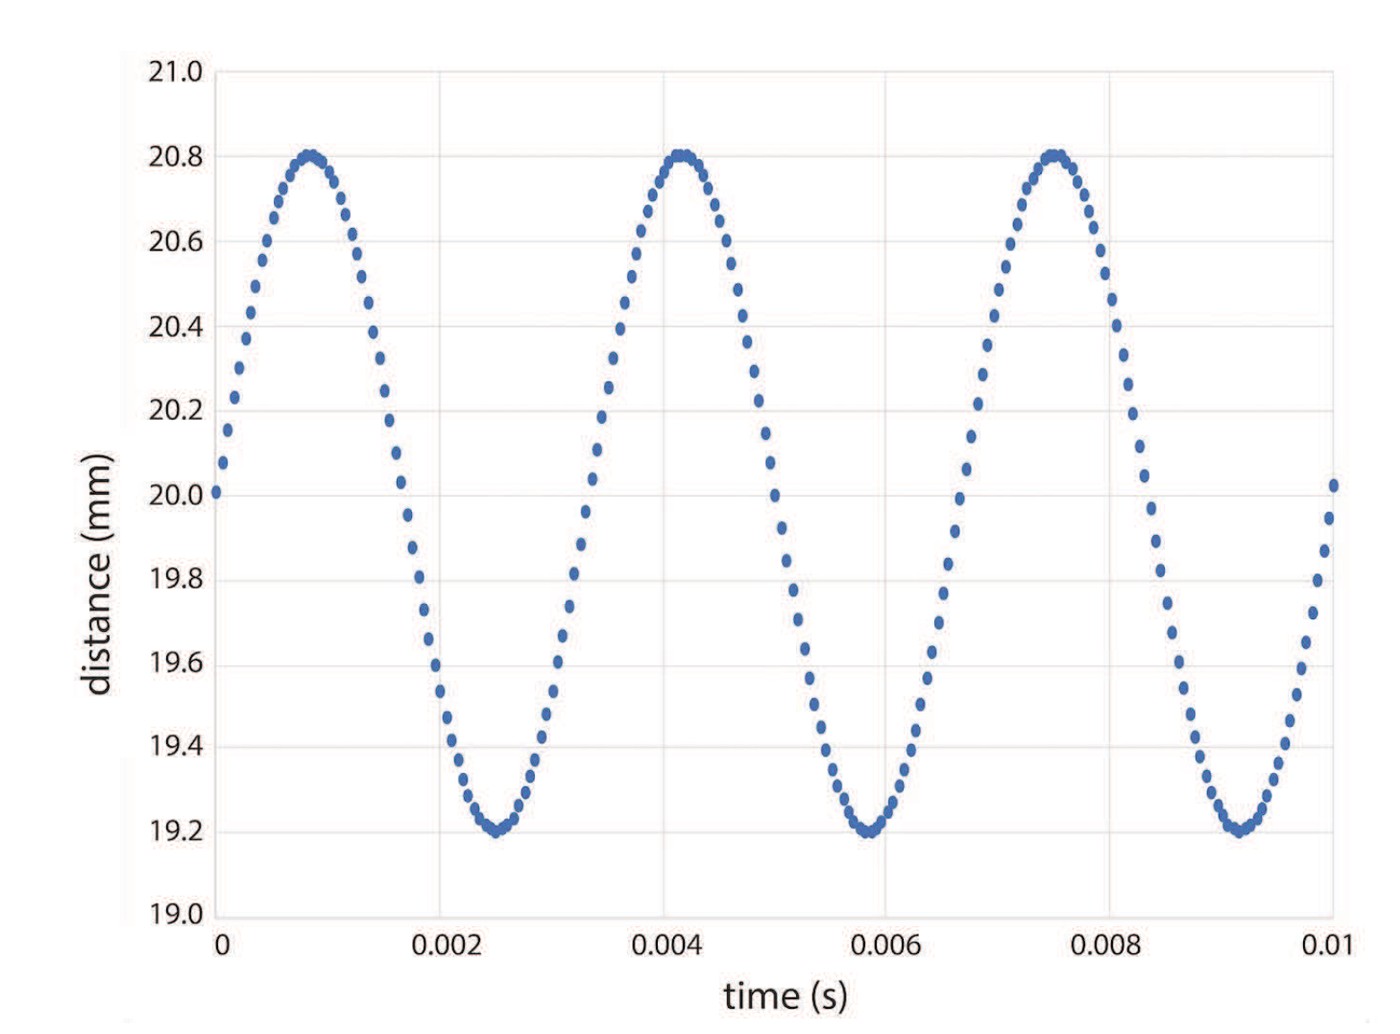
Answer and explanation
One cycle takes about 0.0033 s, giving frequency about 300 Hz using cycles per second = 1/period. The midline is near 20 mm and extrema are about 19.2 and 20.8 mm, so displacement amplitude is about 0.8 mm. Amplitude measures departure from the midline, not distance from the coordinate origin. Allow reasonable approximate readings from this source graph.
Compare consecutive peaks: about 0.0033 s per cycle.
Compute 1/period, approximately 300 cycles per second, or Hz.
Amplitude is about 20.8−20 = 0.8 mm (half the peak-to-peak displacement).
Response criteria
- Read time on the horizontal axis; do not call it wavelength.
- Estimate frequency from repeats per second.
- Measure amplitude from the midline and distinguish coordinate origin from equilibrium.
Problem 13
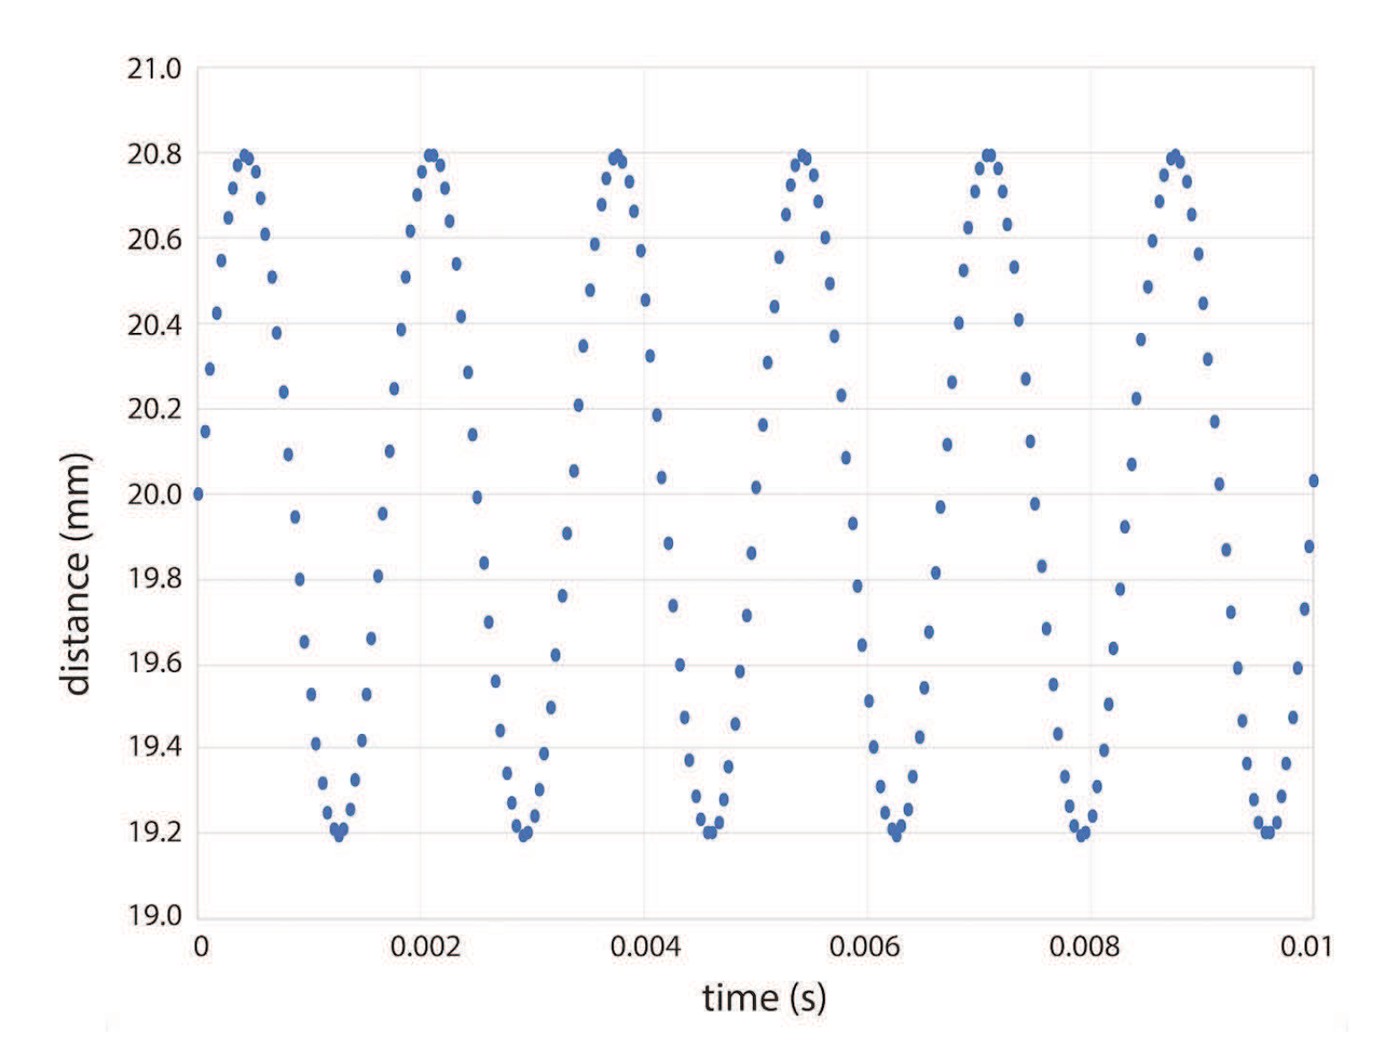
Answer and explanation
One cycle takes about 0.0017 s, giving frequency about 600 Hz using cycles per second = 1/period. The midline is near 20 mm and extrema are about 19.2 and 20.8 mm, so displacement amplitude is about 0.8 mm. Amplitude measures departure from the midline, not distance from the coordinate origin. Allow reasonable approximate readings from this source graph. B has about twice A’s frequency and half its period, while displacement amplitude stays approximately 0.8 mm. Faster repetition does not automatically mean a larger vibration.
Compare consecutive peaks: about 0.0017 s per cycle.
Compute 1/period, approximately 600 cycles per second, or Hz.
Amplitude is about 20.8−20 = 0.8 mm (half the peak-to-peak displacement).
Response criteria
- Read time on the horizontal axis; do not call it wavelength.
- Estimate frequency from repeats per second.
- Measure amplitude from the midline and distinguish coordinate origin from equilibrium.
Problem 14
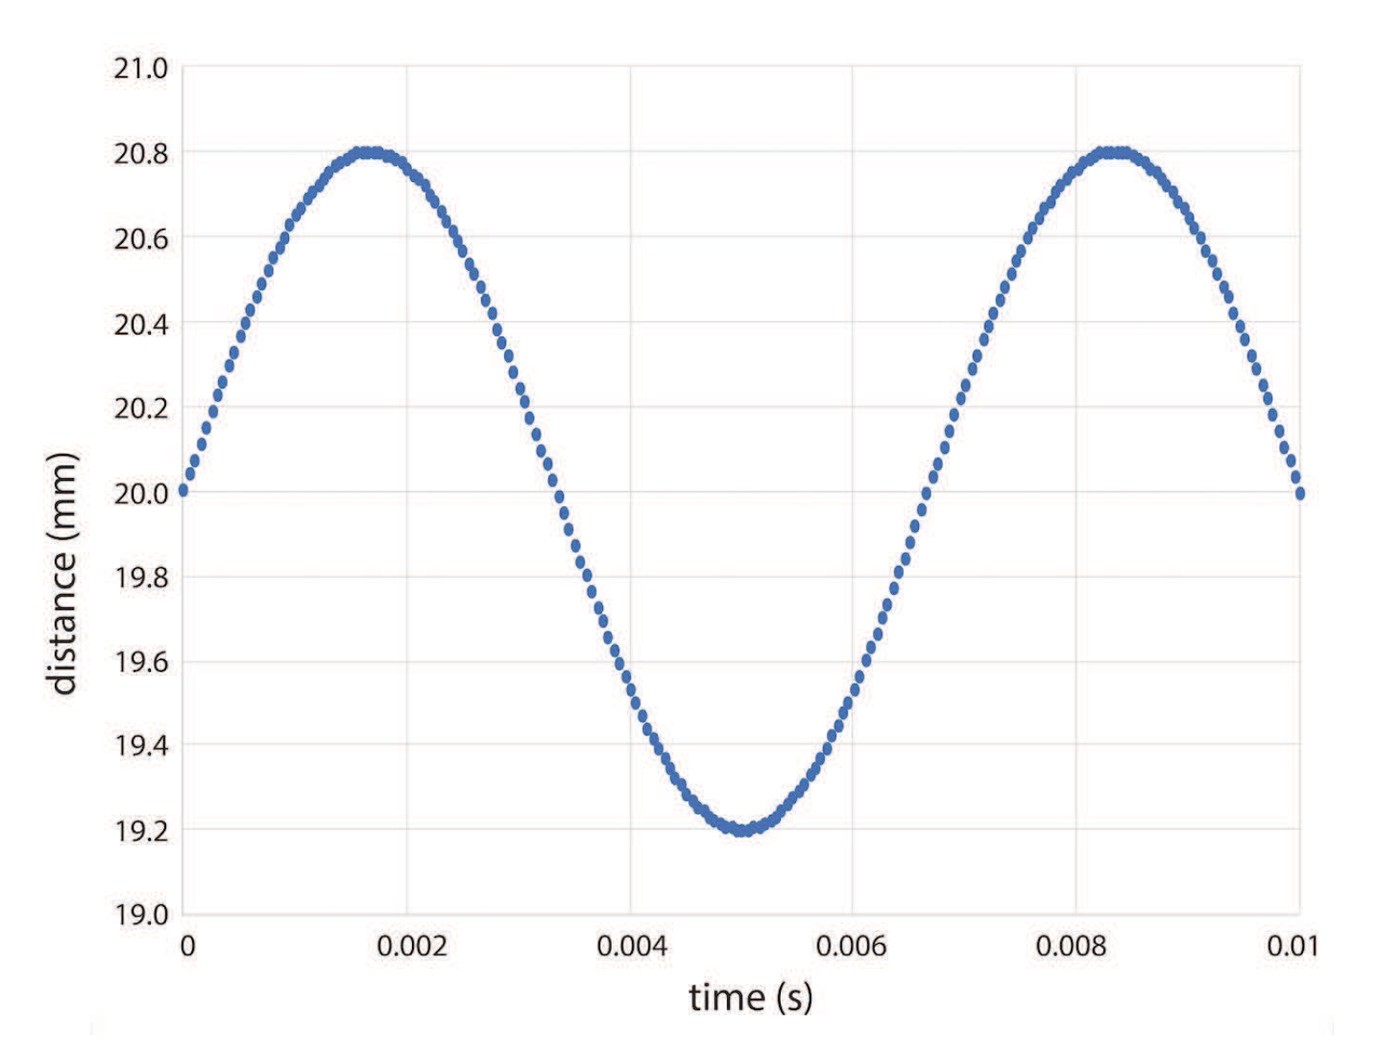
Answer and explanation
One cycle takes about 0.0067 s, giving frequency about 150 Hz using cycles per second = 1/period. The midline is near 20 mm and extrema are about 19.2 and 20.8 mm, so displacement amplitude is about 0.8 mm. Amplitude measures departure from the midline, not distance from the coordinate origin. Allow reasonable approximate readings from this source graph. About 1.5 cycles in 0.010 s gives 150 Hz. Counting only one ignores the half-cycle and would incorrectly give 100 Hz; use the measured period or account for the partial cycle.
Compare consecutive peaks: about 0.0067 s per cycle.
Compute 1/period, approximately 150 cycles per second, or Hz.
Amplitude is about 20.8−20 = 0.8 mm (half the peak-to-peak displacement).
Response criteria
- Read time on the horizontal axis; do not call it wavelength.
- Estimate frequency from repeats per second.
- Measure amplitude from the midline and distinguish coordinate origin from equilibrium.