Sound Waves — Print · Grade 8 Science
Chapter: Waves, Sound & LightSound Waves
Learning goals
- I can describe sound as a longitudinal (compression) wave that needs a medium to travel.
- I can relate pitch to frequency and loudness to amplitude.
Readings for this unit
Before this unit
Know that gases contain particles and waves can be longitudinal.
Use three teaching sessions of about 40–45 minutes: first observe the phenomenon, draft a model and study Parts 1–2; next explain Parts 3–4 with the figures and evidence; then work the application, examples, practice, model revision and exit check. Divide any difficult part into smaller steps and revisit after feedback. Investigations, review and quizzes have separate sessions. Study the four visual parts across the scheduled sessions, then use the illustrated worked case and independent transfer questions. Extend or revisit a session when the learner cannot explain the figure; completion time is a proposed allocation, not a mastery guarantee.
Start with something to explain
What would explain the observations in sound waves?
Illustrative evidence case. An illustrative echo returns 0.30 s after a short sound. The modeled sound speed is 340 m/s, and the path goes from source to wall and back.
Notice and wonder
Do these dots need to travel from speaker to ear? Write two observations from the supplied record without guessing their cause. Include a quantity and its unit when given. An observation is what was recorded; an inference is what you think explains it.
Write one question about why the pattern occurs and one question about a comparison that could distinguish competing explanations. A testable question identifies what could be observed or measured.
Your first model
Before reading the model answer, sketch the named objects or particles and label what you think changes. Find one-way distance and explain the medium’s role. Distinguish particle motion from the travelling disturbance. Keep this first version so you can compare it with your later explanation.
Build the language from the idea
- longitudinal wave
- A wave where particles vibrate back and forth in the SAME direction the wave travels.
- compression
- A region of a longitudinal wave where particles are squeezed close together.
- rarefaction
- A region of a longitudinal wave where particles are spread farther apart.
- pitch
- How high or low a sound seems, determined by its frequency.
- medium
- The matter (solid, liquid, or gas) that a wave travels through.
- model
- A representation that explains selected features and makes predictions; it leaves other details out.
- evidence
- Relevant observations or records used to support or challenge a claim.
- system boundary
- The chosen limit separating the objects being studied from their surroundings.
- assumption
- A condition taken as true for a model or calculation and needing to be checked against the case.
Sound is a longitudinal wave, and that word describes how it moves. Unlike the up-and-down ripples on water, the particles carrying a sound wave vibrate back and forth in the very same direction the wave is traveling. As they do, they create a repeating pattern of two regions: compressions, where the particles are momentarily squeezed close together, and rarefactions, where they're stretched farther apart. A sound wave is really this pattern of squeeze-and-stretch rippling outward from its source.
Ordinary sound needs a material medium such as air, water, or a solid. Local particle interactions pass pressure or elastic disturbances along, so sound does not propagate through a vacuum. Speed depends on the medium’s elastic properties and density, as well as conditions such as temperature. Many solids transmit sound faster than air, but particles being closer together is not a sufficient explanation by itself. Use the speed supplied for the specific medium when calculating distance.
Frequency largely determines a tone’s perceived pitch. Amplitude and intensity relate to loudness under comparable conditions, while frequency, distance, and individual hearing also affect perception. A higher-frequency tone is not necessarily louder, and a louder tone does not necessarily have higher frequency. Compare one feature at a time with supplied records. Quiet observations are sufficient; learners do not need loud sound exposure to study these relationships.
Sound travels at a steady but fairly leisurely pace — about 343 m/s in room-temperature air. That's quick by everyday standards, but far, far slower than light. This speed gap is exactly why you see a distant lightning flash almost instantly but hear its thunder seconds later: the light reaches you nearly at once, while the sound has to plod across all those kilometers. You can even estimate the distance using distance = speed × time — roughly every three seconds of delay means the storm is about a kilometer away.
Grasping how sound waves work explains a surprising amount of daily life — why a thick wall muffles noise (it's a poor medium for passing the vibration through cleanly), why your voice sounds different underwater, and why a tuning fork or a plucked guitar string produces one clear pitch. It's also the foundation of technologies like ultrasound scans, the sonar that maps the ocean floor, and the microphones and speakers that turn vibrating air into signals and back again.
Sound in air consists of pressure variations with compressions and rarefactions. Air particles move back and forth locally while the disturbance travels. Sound needs a material medium, so ordinary sound does not cross a vacuum.
Frequency largely determines pitch, and amplitude relates to loudness under comparable conditions. Sound speed depends on the medium and temperature. A higher-pitched sound in the same air does not simply travel faster because it has a higher frequency.
An echo involves a round trip from source to reflector and back. Multiply travel time by speed to find total path length, then divide by two for the distance to the reflector. Protect hearing: experiments do not require loud sounds or listening close to speakers.
Build your understanding
Where this fits
This unit helps answer the chapter question: How do waves and circuits transfer energy and information? Keep a notebook table with the question, evidence, explanation and one unresolved issue. Revise a previous model only when you can name the new evidence or idea that changes it.
Use three teaching sessions of about 40–45 minutes: first observe the phenomenon, draft a model and study Parts 1–2; next explain Parts 3–4 with the figures and evidence; then work the application, examples, practice, model revision and exit check. Divide any difficult part into smaller steps and revisit after feedback. Investigations, review and quizzes have separate sessions.
Part 1 · Model sound as pressure variations
Sound in air consists of pressure variations that pass through a material medium. Air particles move back and forth locally, creating compressions and rarefactions while the disturbance travels. An ordinary sound wave does not cross a vacuum because no medium particles are present to support that process.
Read the visual model
What travels from a speaker to the listener in this model?
Visual reasoning — after your attempt
The pressure disturbance and energy travel through the air. Individual particles move locally rather than carrying themselves from speaker to listener.
Draw a line of particles with alternating close and less-close spacing. Show travel and local motion along the same axis in the longitudinal model. Do not show one particle traveling all the way from a speaker to a listener.
Pause and explain
What travels from a speaker to the listener in this model?
Check your reasoning after answering
The pressure disturbance and energy travel through the air. Individual particles move locally rather than carrying themselves from speaker to listener.
Part 2 · Distinguish pitch from loudness
Frequency largely determines perceived pitch. Amplitude and intensity relate to perceived loudness under comparable conditions, but distance, hearing, and frequency also affect perception. A louder tone need not have higher frequency, and a high-pitched tone is not necessarily louder. Protect hearing when discussing measurements.
Read the visual model
What changes if a tone’s amplitude increases while frequency stays fixed?
Visual reasoning — after your attempt
Under comparable conditions its intensity and perceived loudness generally increase, while its basic pitch remains linked to the unchanged frequency.
Compare two supplied records with equal cycle rate but different pressure amplitudes. They can have the same basic pitch and different loudness at the same listener position. The example does not require playing loud tones.
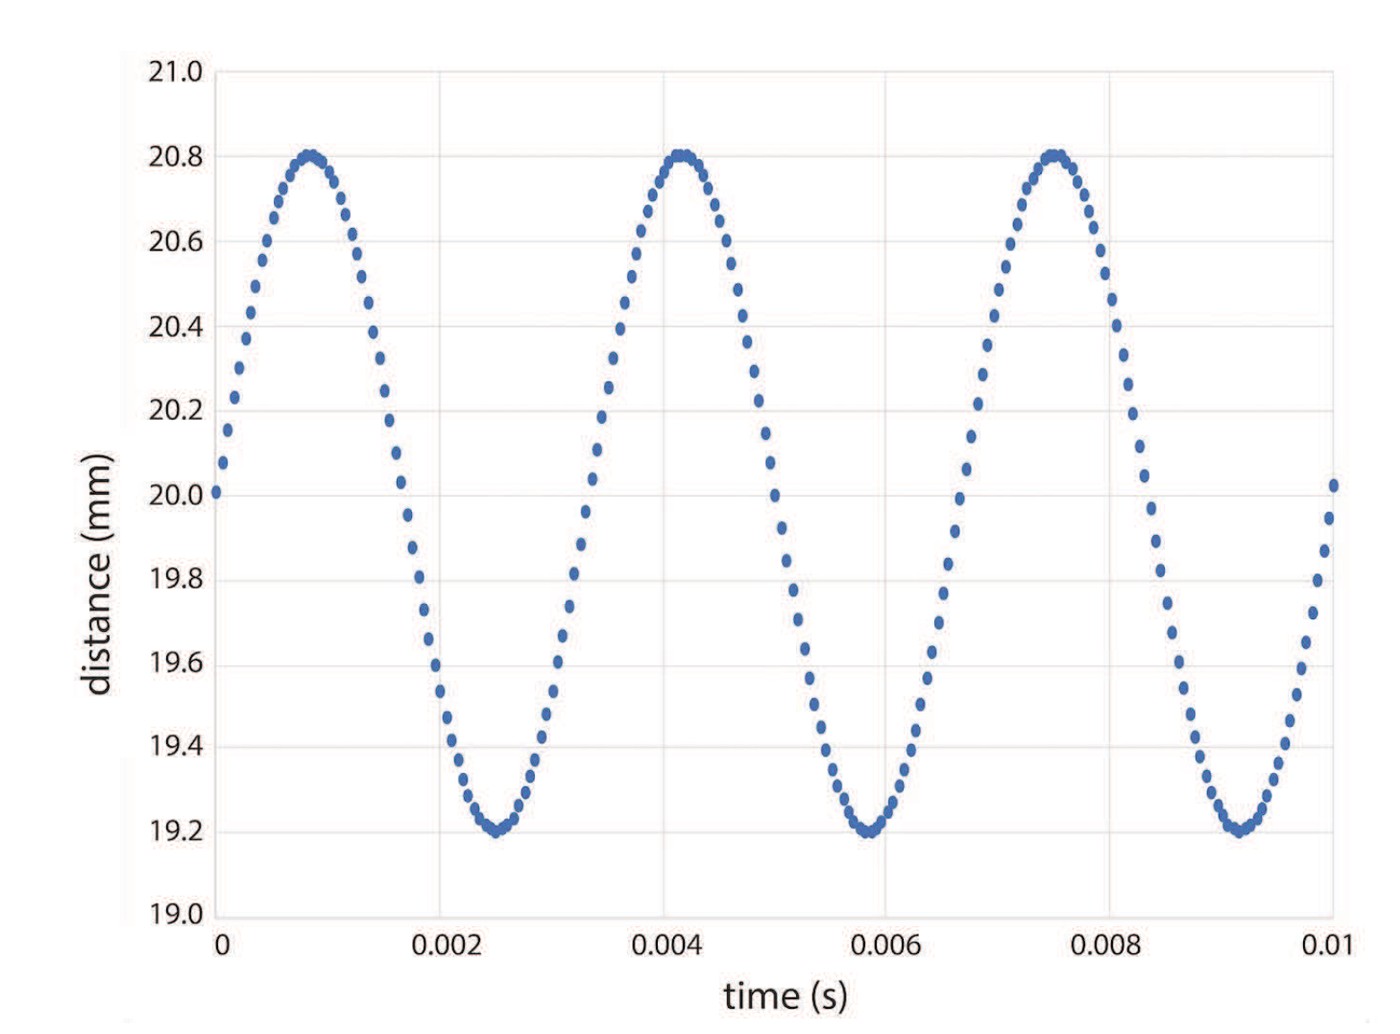
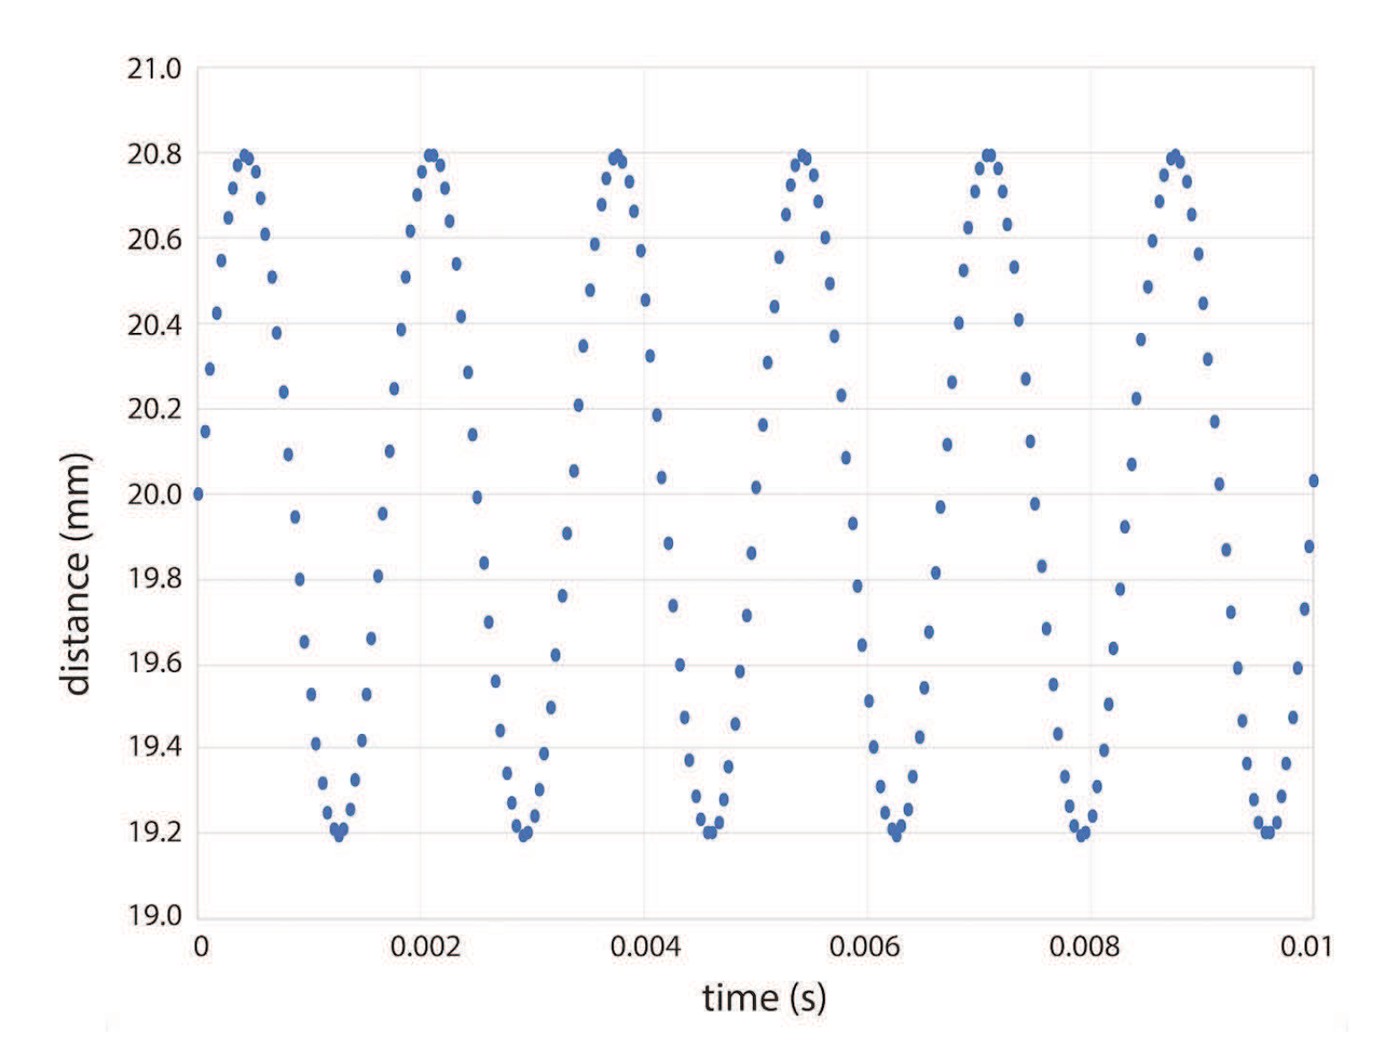
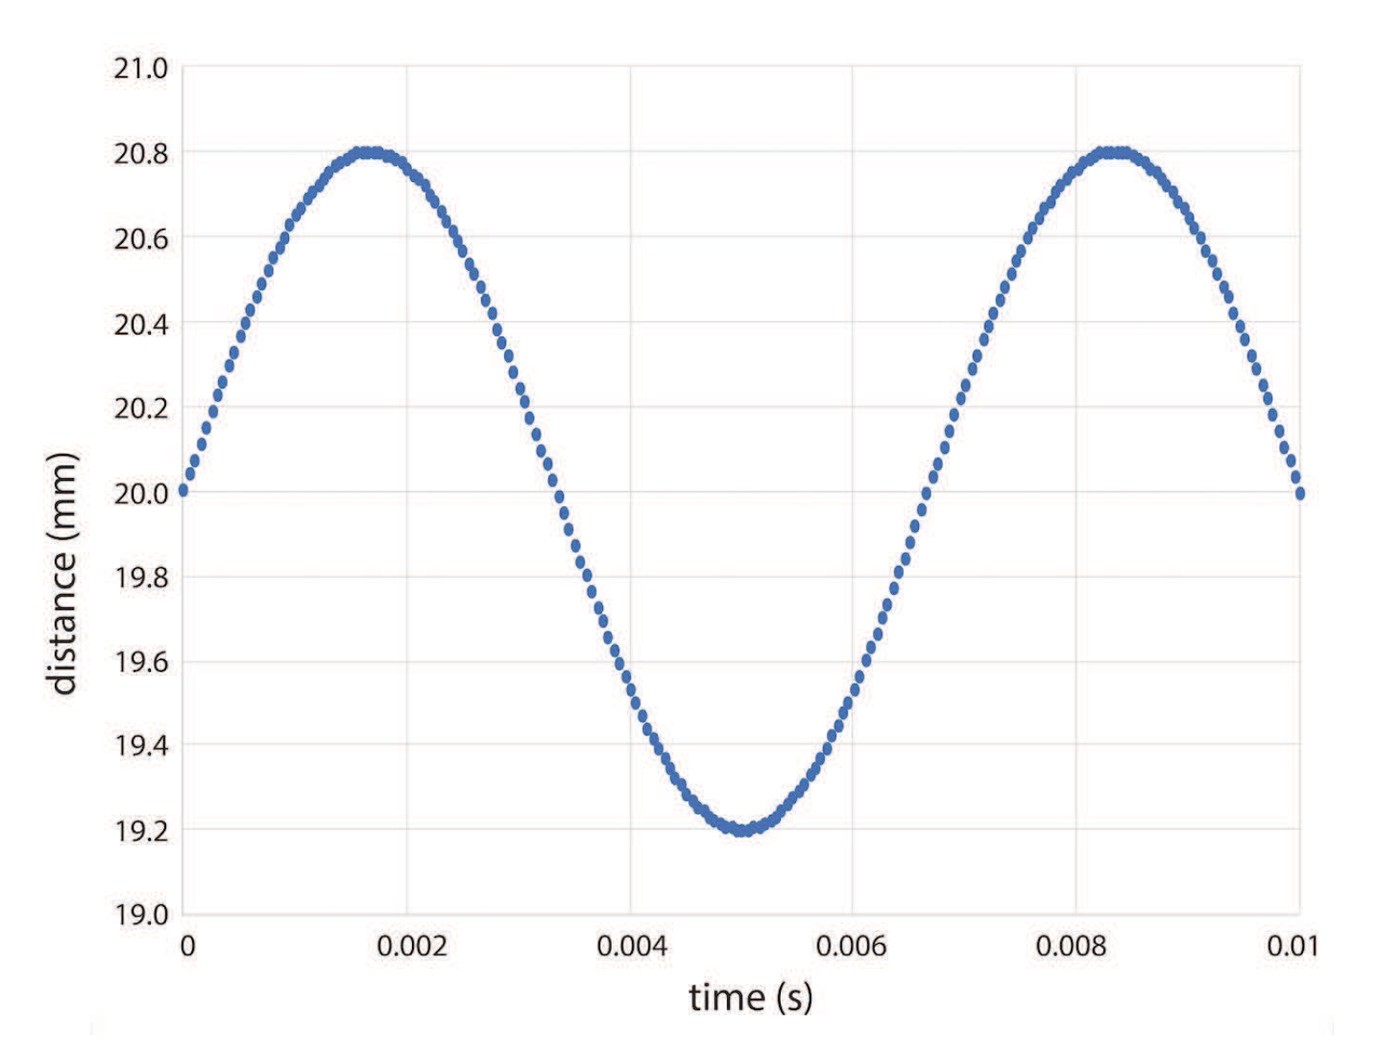
Read A/B/C in the figure as a separate supplied example: divide 2 or 4 cycles by 0.01 s for 200 or 400 Hz. A/B changes frequency while amplitude stays at one relative unit; A/C changes amplitude while frequency stays at 200 Hz. The graph is pressure variation at a location versus time, not the path of a moving air particle. Loudness remains a perception influenced by more than one condition.
Pause and explain
What changes if a tone’s amplitude increases while frequency stays fixed?
Check your reasoning after answering
Under comparable conditions its intensity and perceived loudness generally increase, while its basic pitch remains linked to the unchanged frequency.
Part 3 · State the conditions for sound speed
Sound speed depends on properties such as elasticity, density, and temperature of the medium. A dense material is not automatically a faster medium; stiffness also matters. Many solids carry sound faster than air, but particle closeness alone is an incomplete explanation. Use the supplied speed for a calculation.
Read the visual model
Why should a sound-speed value include a medium or condition?
Visual reasoning — after your attempt
Speed depends on the medium’s properties and temperature. One number is not a universal value for all gases, liquids, solids, or temperatures.
For introductory air calculations near room temperature, a supplied value around 340 m/s may be used. Higher pitch in the same ordinary air does not simply make sound travel faster. Temperature changes can alter the appropriate speed.
For the figure’s supplied models, a one-second disturbance travels 340, 1,500 or 5,000 m respectively. Those labels identify three different medium examples, not three pitches in the same air. Real composition and conditions change the appropriate value, so a medium label and assumptions belong beside the speed.
Pause and explain
Why should a sound-speed value include a medium or condition?
Check your reasoning after answering
Speed depends on the medium’s properties and temperature. One number is not a universal value for all gases, liquids, solids, or temperatures.
Part 4 · Use the full path for echoes
An echo time covers travel to a reflecting surface and back. Multiply speed by total time to find round-trip path length, then divide by two for one-way distance when source and receiver are at the same location. A one-way delay needs a different interpretation.
Read the visual model
When should you divide speed×time by two?
Visual reasoning — after your attempt
When the measured time includes a round trip from the colocated source/receiver to a reflector and back, under the stated path and speed assumptions.
At 340 m/s, an echo after 0.5 s traveled 170 m total, so the reflector is 85 m away in the simple straight-path model. State the round-trip assumption before dividing by two.
Use the figure’s 0.40-second record as another worked case. The clock runs during both arrows, giving 136 m total and 68 m one way. Mark the measured time interval on your drawing before deciding whether to halve the calculated path. A thunder delay describes sound arriving after a light flash and is an approximately one-way case, so it is not treated like an echo.
Pause and explain
When should you divide speed×time by two?
Check your reasoning after answering
When the measured time includes a round trip from the colocated source/receiver to a reflector and back, under the stated path and speed assumptions.
Apply the whole unit · Interpret an echo and two tones
Illustrative record: an echo returns after 0.40 s; use sound speed 340 m/s. Tone A is 250 Hz and tone B 500 Hz, with otherwise comparable measurement conditions.
Your task
Calculate reflector distance, sketch the round-trip path, and compare basic pitch. Explain why frequency alone cannot establish which tone is louder or which arrives faster in the same ordinary air.
What your response should show
- Use the supplied observations and measurements accurately; include units where needed.
- Explain the science behind your answer, rather than giving only a number or label.
- Show a labeled model, calculation, or evidence comparison as requested.
- State an assumption or limitation and suggest a useful next measurement.
Response guidance — after your attempt
Round-trip path=340×0.40=136 m, so reflector distance is 68 m. B has higher basic pitch because its frequency is higher. Loudness needs amplitude/intensity and listening conditions; frequency alone is insufficient. Under the stated ordinary-air approximation both have essentially the supplied speed. The distance calculation assumes a direct out-and-back path.
Scientific references and adapted teaching resources
- OpenSciEd 8.2 Sound Waves — public unit overview
- OpenSciEd 8.3 Forces at a Distance — public unit overview
- OpenSciEd instructional model — storyline routines
- Creative Commons Attribution 4.0 — middle-school material license
Parent / teacher teaching notes
Use a path drawing before division. Keep tests quiet and optional; supplied data are sufficient. Replace explanations based only on particles being closer with medium properties and stated conditions. Adaptation credit: OpenSciEd middle-school teaching routines and public task structures by OpenSciEd, CC BY 4.0. This independent version adds original explanatory text, data and figures, terminology support and a home-study schedule. It does not reproduce the complete teacher editions or their classroom validation.
The key idea
Sound is a longitudinal wave of compressions and rarefactions that needs a medium; frequency controls pitch, and amplitude controls loudness.
Distance from Speed and Time
d = v × t
v is the speed of sound (about 343 m/s in air); t is time in seconds; d is distance in meters.
Worked examples
Example 1
- Use distance = speed × time.
- d = 343 × 6.
- = 2,058.
Example 2 · Worked application
- Sound travels to the wall and back.
- Round-trip distance=340×0.4=136 m.
- One-way distance=136/2=68 m.
Remember the return path; the echo delay is not one-way time.
Example 3
- Rearrange v = f × λ to solve for wavelength: λ = v ÷ f.
- λ = 343 ÷ 686.
- = 0.5.
Example 4
- Total path=340×0.4=136 m.
- The path goes to the wall and back, so wall distance=136/2=68 m.
Example 5 · Find and fix the mistake
- Test the claim against the stated conditions: Remember the return path; the echo delay is not one-way time.
- Loudness relates to amplitude and perception; pitch relates primarily to frequency. They can vary independently.
Remember the return path; the echo delay is not one-way time.
Example 6 · Interpret the visual model
- Identify the represented objects, axes, labeled quantities and stated conditions before choosing a rule.
- Draw a line of particles with alternating close and less-close spacing. Show travel and local motion along the same axis in the longitudinal model. Do not show one particle traveling all the way from a speaker to a listener.
- The pressure disturbance and energy travel through the air. Individual particles move locally rather than carrying themselves from speaker to listener.
Keep the model’s stated limits explicit: A sound wave is a pattern of crowding and spreading passing through matter. Drawing it as particles rather than as a curve makes the requirement obvious: remove the particles and there is nothing left to carry the pattern.
Avoid these mistakes
- An echo's travel time includes the outward and return paths.
Check your understanding
An echo returns after 0.4 s. Using sound speed 340 m/s, find the distance to the reflecting wall.
Discuss the answer
68 m to the wall in this model.
Why does sound need a medium while light can cross space?
Discuss the answer
Sound in air consists of pressure variations with compressions and rarefactions. Air particles move back and forth locally while the disturbance travels. Sound needs a material medium, so ordinary sound does not cross a vacuum. Frequency largely determines pitch, and amplitude relates to loudness under comparable conditions. Sound speed depends on the medium and temperature. A higher-pitched sound in the same air does not simply travel faster because it has a higher frequency.
Return to the phenomenon
An illustrative echo returns 0.30 s after a short sound. The modeled sound speed is 340 m/s, and the path goes from source to wall and back. Find one-way distance and explain the medium’s role. Distinguish particle motion from the travelling disturbance. Revise your first explanation using a named idea from the lesson. Mark the changed part and the evidence that supports it.
Compare explanations after your attempt
The round-trip path is 340×0.30=102 m, so one-way distance is 51 m. Ordinary sound needs matter, with successive compressions and expansions transmitting a disturbance. Individual air particles mainly oscillate near their positions rather than travel the complete path. The arithmetic assumes the stated speed and clear timing.
What should we investigate next?
Which condition could be changed to test a remaining uncertainty in this explanation? State the predicted observation and what result would challenge your model.
Investigate, explain and revise
Use these tasks after the three teaching sessions as needed. Discuss an attempted explanation before opening response guidance; a matching sentence is less important than a supported mechanism.
Activity 1 · Explain the new evidence case
Use the visible scenario above, Parts 1–4 and your first notebook model. No outside reading or equipment is required.
Your task
An illustrative echo returns 0.30 s after a short sound. The modeled sound speed is 340 m/s, and the path goes from source to wall and back. Find one-way distance and explain the medium’s role. Distinguish particle motion from the travelling disturbance. Write 100–150 words or give a labeled drawing with an equivalent oral explanation.
Success criteria
- Use two relevant stated records or conditions.
- Explain the mechanism rather than only repeat a definition.
- Label observation and inference.
- Name a changed model feature or a remaining uncertainty.
Hint
Read the stated boundary and conditions before selecting a relationship. The unit’s worked examples show intermediate steps.
Response guidance — discuss after your attempt
The round-trip path is 340×0.30=102 m, so one-way distance is 51 m. Ordinary sound needs matter, with successive compressions and expansions transmitting a disturbance. Individual air particles mainly oscillate near their positions rather than travel the complete path. The arithmetic assumes the stated speed and clear timing.
Activity 2 · Read and extend the figure
Study the new labeled figure and its caption, then compare it with the associated teaching part.
Your task
Do these dots need to travel from speaker to ear? Explain what each important label represents. Add one missing feature that would be needed for a different question, and explain why the original figure leaves it out.
Success criteria
- Answer the figure question with its stated labels.
- Connect the visual representation to the scientific idea.
- Identify a specific limitation from the caption.
- Propose a useful change without misrepresenting supplied evidence.
Hint
The dots model local particle crowding rather than literal air colors. Compressions and rarefactions form a traveling disturbance while particles mainly oscillate locally. The two arrow types distinguish disturbance propagation from local motion; the schematic omits particle-scale distances and random thermal motion.
Response guidance — discuss after your attempt
No. Successive interactions can transfer the disturbance while the particles mainly move near their local positions. The dots model local particle crowding rather than literal air colors. Compressions and rarefactions form a traveling disturbance while particles mainly oscillate locally. The two arrow types distinguish disturbance propagation from local motion; the schematic omits particle-scale distances and random thermal motion.
Words to know
- longitudinal wave
- A wave where particles vibrate back and forth in the SAME direction the wave travels.
- compression
- A region of a longitudinal wave where particles are squeezed close together.
- rarefaction
- A region of a longitudinal wave where particles are spread farther apart.
- pitch
- How high or low a sound seems, determined by its frequency.
- medium
- The matter (solid, liquid, or gas) that a wave travels through.
- model
- A representation that explains selected features and makes predictions; it leaves other details out.
- evidence
- Relevant observations or records used to support or challenge a claim.
- system boundary
- The chosen limit separating the objects being studied from their surroundings.
- assumption
- A condition taken as true for a model or calculation and needing to be checked against the case.
Sound travels faster through solids and liquids than through air
Sound needs particles bumping into their neighbors to travel, so the more tightly packed those particles are, the faster a sound wave can move through them. Sound travels through air at about 343 m/s, but through water at about 1,480 m/s — over four times faster — and through solid steel at roughly 5,960 m/s, more than seventeen times faster than air. That's why old Western movies show characters pressing an ear to a train track: solid metal rails carry the sound of an approaching train far faster (and farther) than the air ever could.
The Doppler effect: why a siren's pitch drops as it passes you
In 1842, Austrian physicist Christian Doppler proposed that a moving sound source should seem to shift pitch for a listener — sound waves bunch closer together in front of a source moving toward you (raising the frequency and pitch you hear) and stretch farther apart behind it (lowering the pitch). Three years later, Dutch scientist Buys Ballot tested the idea in a memorable experiment: trumpet players performed a single sustained note aboard a moving train, while musicians with sharp pitch memory listened from the platform and confirmed the pitch really did shift exactly as Doppler predicted. You hear this exact effect every time an ambulance siren passes you on the street.
Decibels: measuring loudness on a logarithmic scale
Like the pH scale, the decibel (dB) scale used for loudness is logarithmic, not a simple straight-line ruler: every increase of 10 dB means the sound's intensity is 10 times greater, not just '10 units louder.' A whisper measures around 30 dB, normal conversation around 60 dB, and a loud rock concert around 110 dB — meaning that concert isn't just 'somewhat louder' than a conversation, its sound intensity is roughly 100,000 times greater (a 50 dB gap = 10⁵). That's exactly why sustained exposure to loud concerts and headphones can damage hearing so much faster than people expect.
Echolocation: seeing with sound
Bats and dolphins navigate and hunt using echolocation: they emit rapid ultrasonic pulses — sound waves with frequencies above 20,000 Hz, higher than human ears can detect — and listen for the returning echoes to build a detailed picture of their surroundings, including the size, shape, distance, and even texture of nearby objects and prey. Humans borrowed the same trick technologically: sonar lets ships and submarines 'see' underwater using sound pulses, and medical ultrasound imaging uses the same principle of interpreting echoes to safely picture a developing fetus or internal organs without any radiation.
In the real world
Counting the seconds between seeing lightning and hearing thunder lets you estimate how far away a storm is.
Exit check
Do these dots need to travel from speaker to ear? Explain the relevant mechanism and one model limitation.
Check your explanation after answering
No. Successive interactions can transfer the disturbance while the particles mainly move near their local positions. The dots model local particle crowding rather than literal air colors. Compressions and rarefactions form a traveling disturbance while particles mainly oscillate locally. The two arrow types distinguish disturbance propagation from local motion; the schematic omits particle-scale distances and random thermal motion.
Explain your reasoning without notes. If a key idea is missing, revisit the lesson and try again.
Problem 1
Answer and explanation
1360 m
distance = speed × time = 340 × 4 = 1,360 m.
Problem 2
- transverse
- longitudinal
- electromagnetic
- standing only
Answer and explanation
longitudinal
Sound particles vibrate in the same direction the wave travels, making it a longitudinal wave.
Problem 3
- higher
- lower
- louder only
- quieter only
Answer and explanation
higher
Higher frequency corresponds to higher pitch.
Problem 4
- water
- steel
- a vacuum (empty space)
- air
Answer and explanation
a vacuum (empty space)
Sound needs a medium of particles to travel through, so it cannot travel through a vacuum.
Problem 5
Answer and explanation
The speaker cone vibrates back and forth, pushing air molecules together to create compressions and pulling them apart to create rarefactions. This repeating pattern travels outward through the air as a sound wave.
Problem 6
Answer and explanation
400 Hz
f = v ÷ λ = 340 ÷ 0.85 = 400 Hz.
Problem 7
Answer and explanation
68 m to the wall in this model.
Total path=340×0.4=136 m.
The path goes to the wall and back, so wall distance=136/2=68 m.
Response criteria
- Use the stated conditions.
- Show the evidence or calculation.
- Explain the conclusion and any stated limitation.
Problem 8
Hints
Remember the return path; the echo delay is not one-way time.
Answer and explanation
The 400 Hz sound, because its frequency is higher.
Problem 9
Hints
State what the supplied observations or conditions establish, and separate that from any assumption.
Answer and explanation
Sound needs particles of a medium to transmit mechanical disturbances; a vacuum lacks that medium.
Problem 10
Answer and explanation
The pressure disturbance and energy travel through the air. Individual particles move locally rather than carrying themselves from speaker to listener.
Draw a line of particles with alternating close and less-close spacing. Show travel and local motion along the same axis in the longitudinal model. Do not show one particle traveling all the way from a speaker to a listener.
The pressure disturbance and energy travel through the air. Individual particles move locally rather than carrying themselves from speaker to listener.
Response criteria
- Use the named labels, directions or supplied quantities accurately.
- Connect the visual evidence to the scientific mechanism or calculation.
- State the relevant model conditions or limitation.
Problem 11
Answer and explanation
Round-trip length is 340×0.3 = 102 m, so reflector distance is 51 m. The measured time includes travel out and back.
Draw both travel legs.
Divide total path by two only under the stated same-path out-and-back comparison.
Round-trip length is 340×0.3 = 102 m, so reflector distance is 51 m. The measured time includes travel out and back.
Response criteria
- Use the named labels, directions or supplied quantities accurately.
- Connect the visual evidence to the scientific mechanism or calculation.
- State the relevant model conditions or limitation.
Problem 12
Answer and explanation
One cycle takes about 0.0033 s, giving frequency about 300 Hz using cycles per second = 1/period. The midline is near 20 mm and extrema are about 19.2 and 20.8 mm, so displacement amplitude is about 0.8 mm. Amplitude measures departure from the midline, not distance from the coordinate origin. Allow reasonable approximate readings from this source graph.
Compare consecutive peaks: about 0.0033 s per cycle.
Compute 1/period, approximately 300 cycles per second, or Hz.
Amplitude is about 20.8−20 = 0.8 mm (half the peak-to-peak displacement).
Response criteria
- Read time on the horizontal axis; do not call it wavelength.
- Estimate frequency from repeats per second.
- Measure amplitude from the midline and distinguish coordinate origin from equilibrium.
Problem 13
Answer and explanation
One cycle takes about 0.0017 s, giving frequency about 600 Hz using cycles per second = 1/period. The midline is near 20 mm and extrema are about 19.2 and 20.8 mm, so displacement amplitude is about 0.8 mm. Amplitude measures departure from the midline, not distance from the coordinate origin. Allow reasonable approximate readings from this source graph. B has about twice A’s frequency and half its period, while displacement amplitude stays approximately 0.8 mm. Faster repetition does not automatically mean a larger vibration.
Compare consecutive peaks: about 0.0017 s per cycle.
Compute 1/period, approximately 600 cycles per second, or Hz.
Amplitude is about 20.8−20 = 0.8 mm (half the peak-to-peak displacement).
Response criteria
- Read time on the horizontal axis; do not call it wavelength.
- Estimate frequency from repeats per second.
- Measure amplitude from the midline and distinguish coordinate origin from equilibrium.
Problem 14
Answer and explanation
One cycle takes about 0.0067 s, giving frequency about 150 Hz using cycles per second = 1/period. The midline is near 20 mm and extrema are about 19.2 and 20.8 mm, so displacement amplitude is about 0.8 mm. Amplitude measures departure from the midline, not distance from the coordinate origin. Allow reasonable approximate readings from this source graph. About 1.5 cycles in 0.010 s gives 150 Hz. Counting only one ignores the half-cycle and would incorrectly give 100 Hz; use the measured period or account for the partial cycle.
Compare consecutive peaks: about 0.0067 s per cycle.
Compute 1/period, approximately 150 cycles per second, or Hz.
Amplitude is about 20.8−20 = 0.8 mm (half the peak-to-peak displacement).
Response criteria
- Read time on the horizontal axis; do not call it wavelength.
- Estimate frequency from repeats per second.
- Measure amplitude from the midline and distinguish coordinate origin from equilibrium.